机器学习(ML)(九) — 探析

密度估计

密度估计(Density Estimation)是一种用于估计随机变量的概率密度函数(PDF)的非参数统计方法。它通过对样本数据进行分析,提供一个平滑的函数,以表示数据在不同值上的分布情况。密度估计(Density Estimation)在数据分析机器学习信号处理等多个领域中具有广泛应用。

密度估计(Density Estimation)的主要方法包括:直方图(Histogram)、核密度估计(Kernel Density Estimation, KDE)、参数密度估计

  • 直方图(Histogram):直方图是最基本的密度估计方法之一。通过将数据范围划分为若干个区间(称为“”),并计算每个区间内的数据点数量,直方图可以直观地展示数据分布。优点:简单易懂,易于实现;缺点:对箱宽和起始位置敏感,可能导致信息损失。不够平滑,无法很好地捕捉数据的细微结构。
  • 核密度估计(Kernel Density Estimation, KDE):核密度估计是一种更为灵活和光滑的密度估计方法。它通过在每个数据点周围放置一个核函数(如高斯核)来构建平滑的密度曲线KDE的公式为:。其中是数据点的估计密度,是样本数量,是核函数,是带宽参数,决定了核的宽度。优点:提供平滑的密度估计,能够更好地捕捉数据的分布特征,可以选择不同类型的核函数,以适应不同的数据分布。缺点:带宽选择对结果影响较大,选择不当可能导致过拟合欠拟合,在高维空间中计算复杂度较高,可能导致“维度诅咒”。
  • 参数密度估计参数密度估计假设数据遵循某种已知的分布(如正态分布指数分布等),通过最大似然估计贝叶斯方法来估计参数。这种方法通常适用于数据量较少且对分布有先验知识的情况。优点:计算效率高,模型简单。缺点:对模型假设敏感,如果真实分布与假设不符,可能导致偏差。

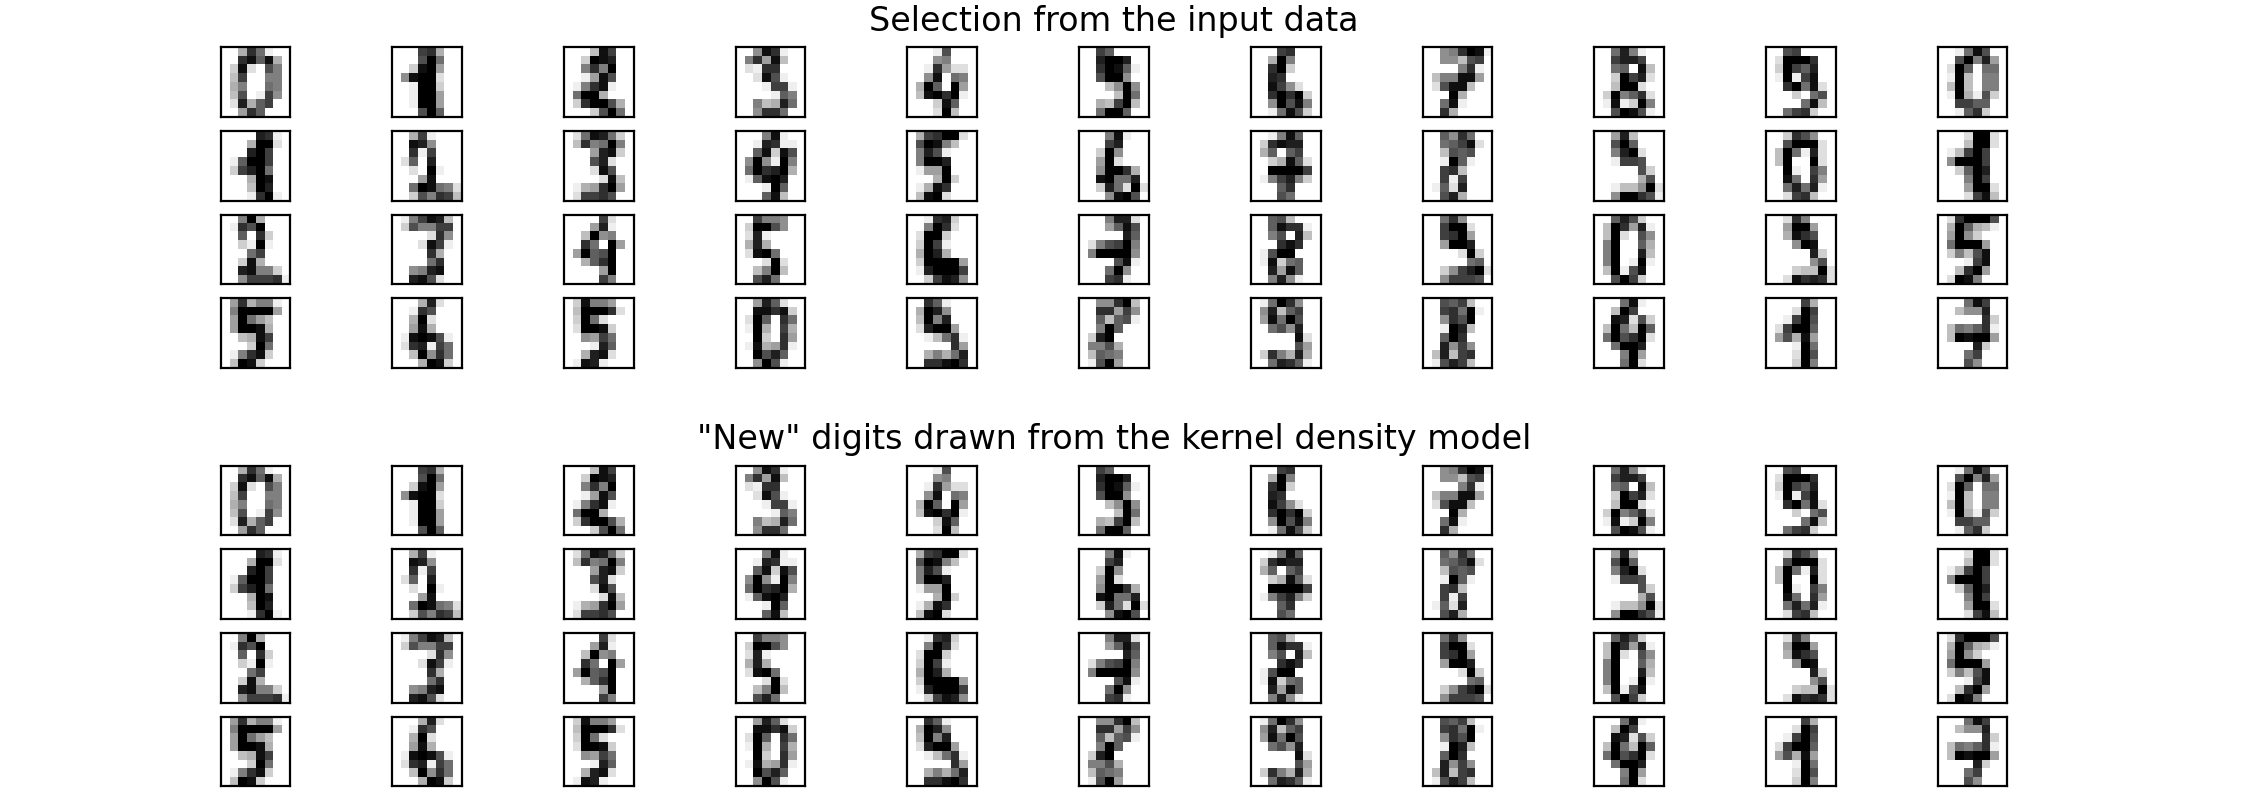
密度估计(Density Estimation)是一种重要的统计工具,通过不同的方法可以有效地描述和理解数据的分布特征。无论是使用简单的直方图还是更复杂的核密度估计,选择合适的方法和参数对于获取准确和有意义的结果至关重要。这里举一个例子,使用核密度估计(KDE)学习手写数字数据的生成模型并从该模型中提取新样本。

1
2
3
4
5
6
7
8
9
10
11
12
13
14
15
16
17
18
19
20
21
22
23
24
25
26
27
28
29
30
31
32
33
34
35
36
37
38
39
40
41
42
43
44
import matplotlib.pyplot as plt
import numpy as np
from sklearn.datasets import load_digits
from sklearn.decomposition import PCA
from sklearn.model_selection import GridSearchCV
from sklearn.neighbors import KernelDensity

# load the data
digits = load_digits()
# project the 64-dimensional data to a lower dimension
pca = PCA(n_components=15, whiten=False)
data = pca.fit_transform(digits.data)

# use grid search cross-validation to optimize the bandwidth
params = {"bandwidth": np.logspace(-1, 1, 20)}
grid = GridSearchCV(KernelDensity(), params)
grid.fit(data)

print("best bandwidth: {0}".format(grid.best_estimator_.bandwidth))

# use the best estimator to compute the kernel density estimate
kde = grid.best_estimator_

# sample 44 new points from the data
new_data = kde.sample(44, random_state=0)
new_data = pca.inverse_transform(new_data)

# turn data into a 4 x 11 grid
new_data = new_data.reshape(4, 11, -1)
real_data = digits.data[:44].reshape(4, 11, -1)

# plot real digits and resample digits
fig, ax = plt.subplots(9, 11, subplot_kw=dict(xticks=[], yticks=[]))
for j in range(11):
ax[4, j].set_visible(False)
for i in range(4):
im = ax[i, j].imshow(real_data[i, j].reshape((8, 8)), cmap=plt.cm.binary, interpolation="nearest")
im.set_clim(0, 16)
im = ax[i + 5, j].imshow(real_data[i, j].reshape((8, 8)), cmap=plt.cm.binary, interpolation="nearest")
im.set_clim(0, 16)

ax[0, 5].set_title("Selection from the input data")
ax[5, 5].set_title('"New" digits drawn from the kernel density model')
plt.show()

高斯混合模型(Gaussian Mixture Model)

高斯混合模型(GMM)是一种基于概率的统计模型,假设所有数据点是由多个高斯分布的混合生成的。它广泛应用于聚类密度估计分类等任务。高斯混合模型(GMM)的核心思想是将复杂的数据分布视为多个简单的高斯分布的组合,从而更好地捕捉数据的多样性和复杂性。

  • 高斯分布高斯分布,也称为正态分布,是一种在自然界中常见的概率分布,其概率密度函数呈现出钟形曲线。多维高斯分布则通过均值向量协方差矩阵来描述。
  • 混合模型高斯混合模型(GMM)将数据视为多个高斯分布的加权组合。每个高斯分布对应一个“成分”,其权重表示该成分在整体模型中的重要性。
  • 数学表示高斯混合模型(GMM)的概率密度函数可以表示为:,其中是成分数量,是第个成分的权重,是以均值和协方差为参数的高斯分布。

高斯混合模型(GMM)通常使用期望最大化(Expectation-Maximization, EM)算法进行参数估计。EM算法包含两个步骤:

  • 期望步骤E步):计算每个数据点属于各个成分的后验概率。
  • 最大化步骤M步):根据后验概率更新模型参数,包括均值、协方差和权重。

这个过程会反复进行,直到收敛于某个稳定状态。高斯混合模型(GMM)在多个领域有广泛应用,包括:

  • 聚类分析:相比于K-means高斯混合模型(GMM)可以处理形状各异、大小不同的簇,并允许数据点有一定的模糊分类(软分类)。
  • 密度估计:通过高斯混合模型(GMM),可以对复杂的数据分布进行建模,从而生成新的样本或进行异常检测。
  • 图像处理与计算机视觉:在图像分割、目标检测等任务中,高斯混合模型(GMM)可以有效地提取特征。
  • 语音识别:在语音信号处理领域,高斯混合模型(GMM)被用来建模声音特征,以提高识别精度。

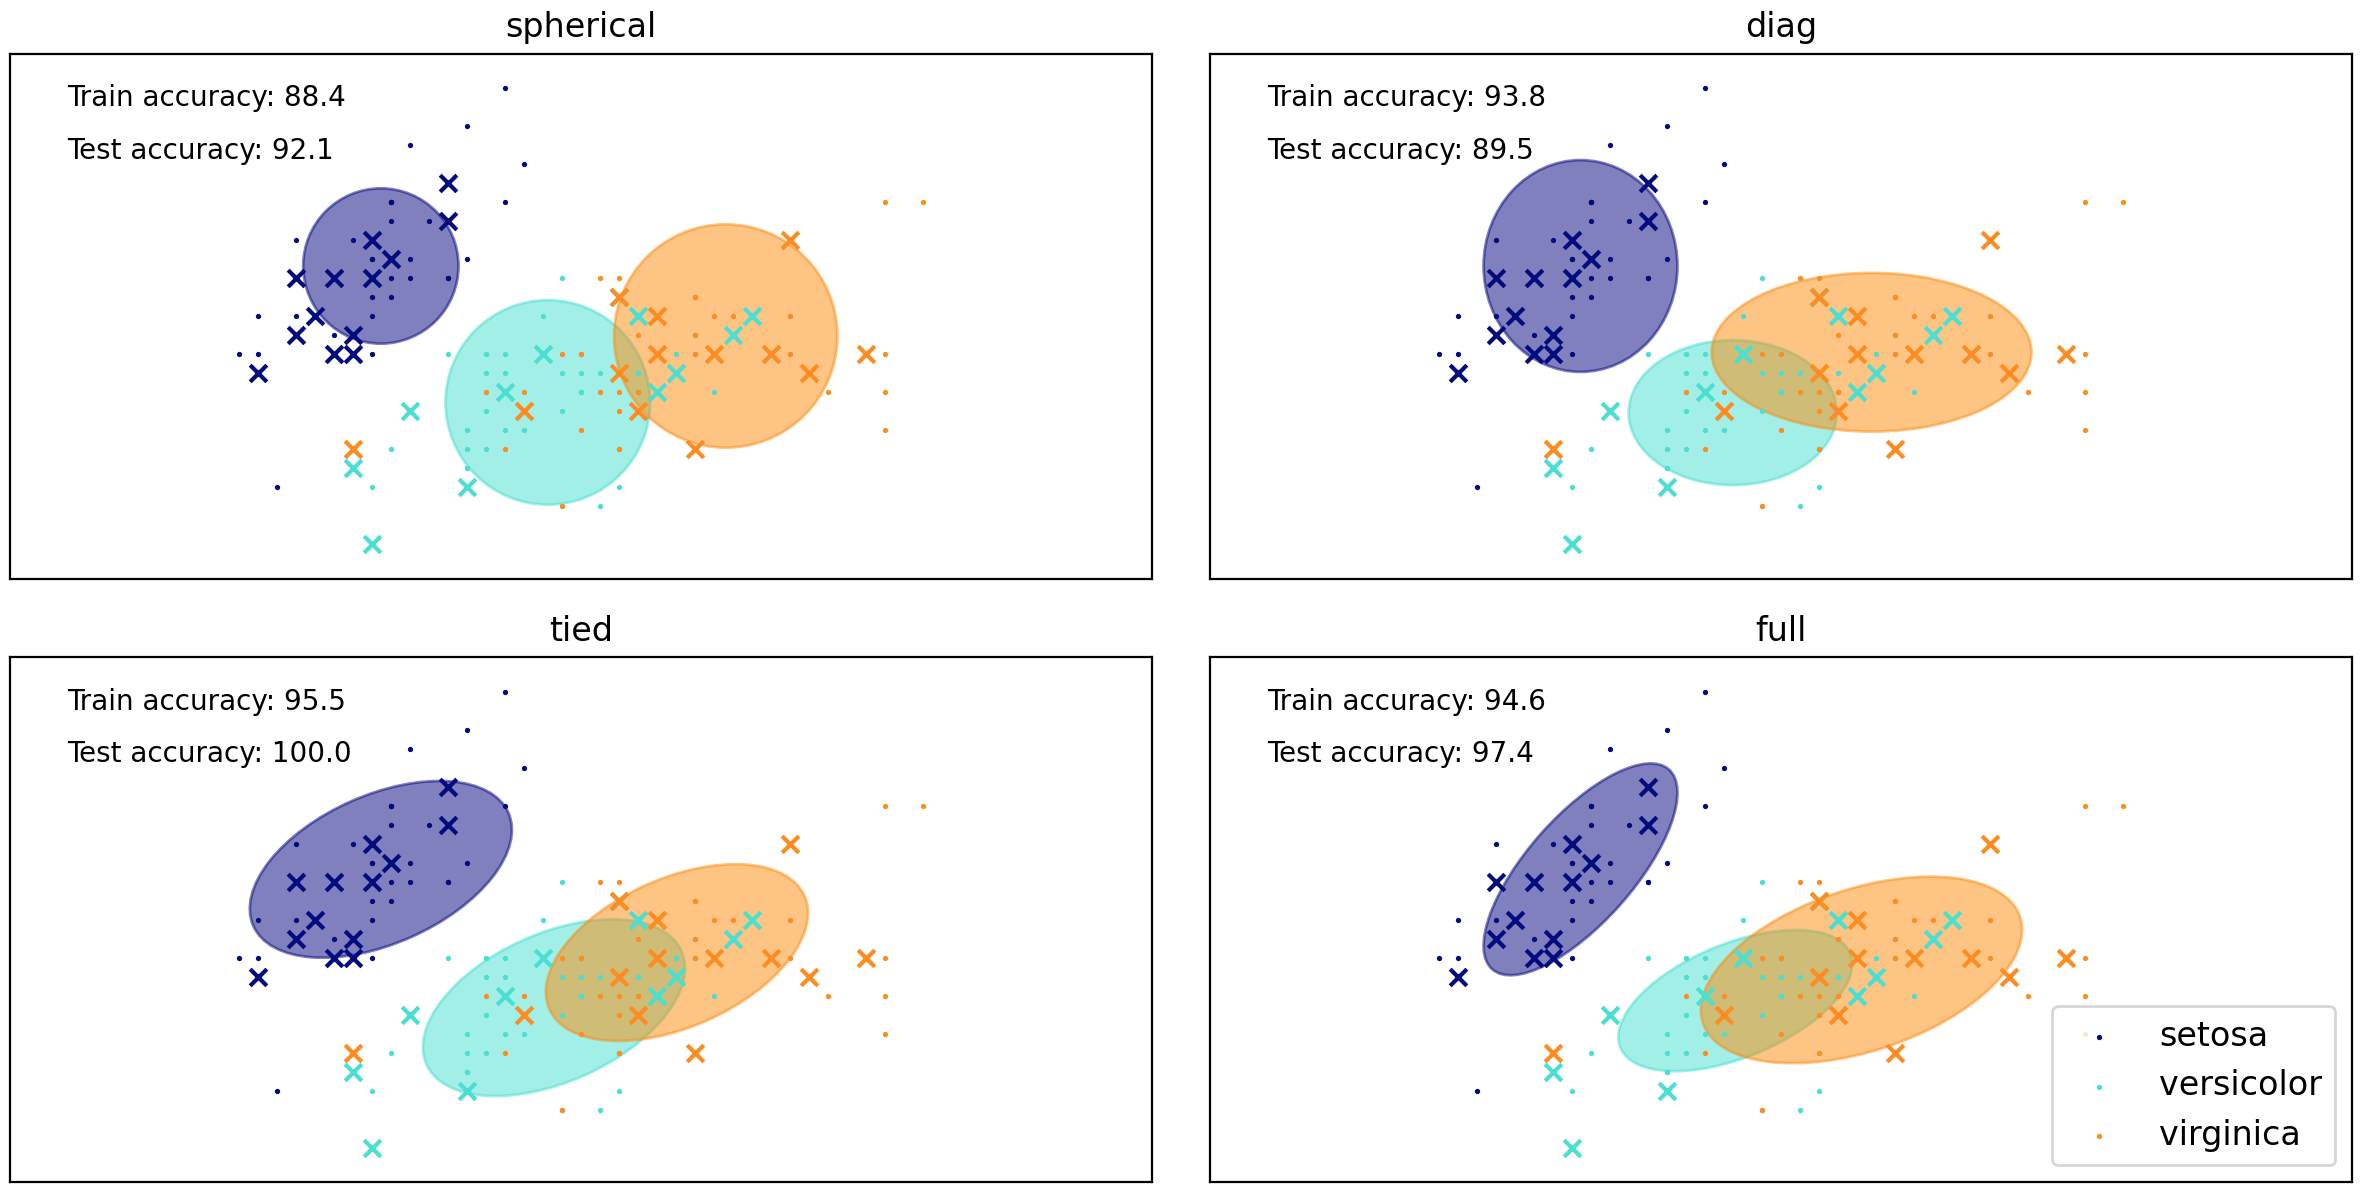
高斯混合模型(GMM)是一种概率模型,它假设所有数据点都是由有限数量的高斯分布与未知参数的混合生成的。我们可以将高斯混合模型(GMM)视为扩展的K-means聚类,并纳入有关数据协方差结构以及潜在高斯中心的信息。这里举例说明,高斯混合模型(GMM)的协方差类型。我们使用鸢尾花数据集上的各种高斯混合模型(GMM)协方差类型在训练和测试数据上绘制预测标签。将高斯混合模型(GMM)与球面、对角、完整和绑定协方差矩阵进行比较,按性能的升序排列。虽然看起来完整协方差表现最佳,但它在小型数据集上容易过度拟合,并且不能很好地推广到测试数据集。

1
2
3
4
5
6
7
8
9
10
11
12
13
14
15
16
17
18
19
20
21
22
23
24
25
26
27
28
29
30
31
32
33
34
35
36
37
38
39
40
41
42
43
44
45
46
47
48
49
50
51
52
53
54
55
56
57
58
59
60
61
62
63
64
65
66
67
68
69
70
71
72
73
74
75
76
77
78
79
80
81
82
83
84
85
86
87
import matplotlib as mpl
import matplotlib.pyplot as plt
import numpy as np
from sklearn import datasets
from sklearn.mixture import GaussianMixture
from sklearn.model_selection import StratifiedKFold

colors = ["navy", "turquoise", "darkorange"]

def make_ellipses(gmm, ax):
for n, color in enumerate(colors):
if gmm.covariance_type == "full":
covariances = gmm.covariances_[n][:2, :2]
elif gmm.covariance_type == "tied":
covariances = gmm.covariances_[:2, :2]
elif gmm.covariance_type == "diag":
covariances = np.diag(gmm.covariances_[n][:2])
elif gmm.covariance_type == "spherical":
covariances = np.eye(gmm.means_.shape[1]) * gmm.covariances_[n]
v, w = np.linalg.eigh(covariances)
u = w[0] / np.linalg.norm(w[0])
angle = np.arctan2(u[1], u[0])
angle = 180 * angle / np.pi # convert to degrees
v = 2.0 * np.sqrt(2.0) * np.sqrt(v)
ell = mpl.patches.Ellipse(gmm.means_[n, :2], v[0], v[1], angle=180 + angle, color=color)
ell.set_clip_box(ax.bbox)
ell.set_alpha(0.5)
ax.add_artist(ell)
ax.set_aspect("equal", "datalim")

iris = datasets.load_iris()

# Break up the dataset into non-overlapping training (75%) and testing
# (25%) sets.
skf = StratifiedKFold(n_splits=4)
# Only take the first fold.
train_index, test_index = next(iter(skf.split(iris.data, iris.target)))

X_train = iris.data[train_index]
y_train = iris.target[train_index]
X_test = iris.data[test_index]
y_test = iris.target[test_index]

n_classes = len(np.unique(y_train))

# Try GMMs using different types of covariances.
estimators = {
cov_type: GaussianMixture(n_components=n_classes, covariance_type=cov_type, max_iter=20, random_state=0)
for cov_type in ["spherical", "diag", "tied", "full"]
}
n_estimators = len(estimators)

plt.figure(figsize=(3 * n_estimators // 2, 6))
plt.subplots_adjust(bottom=0.01, top=0.95, hspace=0.15, wspace=0.05, left=0.01, right=0.99)
for index, (name, estimator) in enumerate(estimators.items()):
# Since we have class labels for the training data, we can
# initialize the GMM parameters in a supervised manner.
estimator.means_init = np.array([X_train[y_train == i].mean(axis=0) for i in range(n_classes)])

# Train the other parameters using the EM algorithm.
estimator.fit(X_train)

h = plt.subplot(2, n_estimators // 2, index + 1)
make_ellipses(estimator, h)

for n, color in enumerate(colors):
data = iris.data[iris.target == n]
plt.scatter(data[:, 0], data[:, 1], s=0.8, color=color, label=iris.target_names[n])
# Plot the test data with crosses
for n, color in enumerate(colors):
data = X_test[y_test == n]
plt.scatter(data[:, 0], data[:, 1], marker="x", color=color)

y_train_pred = estimator.predict(X_train)
train_accuracy = np.mean(y_train_pred.ravel() == y_train.ravel()) * 100
plt.text(0.05, 0.9, "Train accuracy: %.1f" % train_accuracy, transform=h.transAxes)

y_test_pred = estimator.predict(X_test)
test_accuracy = np.mean(y_test_pred.ravel() == y_test.ravel()) * 100
plt.text(0.05, 0.8, "Test accuracy: %.1f" % test_accuracy, transform=h.transAxes)

plt.xticks(())
plt.yticks(())
plt.title(name)

plt.legend(scatterpoints=1, loc="lower right", prop=dict(size=12))
plt.show()

在图中,训练数据以点显示,而测试数据以十字显示。

变分贝叶斯高斯混合模型(VB-GMM)

变分贝叶斯高斯混合模型(VB-GMM)是一种强大的统计技术,用于数据分析中的聚类密度估计。它将高斯混合模型(GMM)的概念与变分推断结合在一起,允许有效地近似后验分布。这里再提一下高斯混合模型(GMM)的原理:高斯混合模型(GMM)假设数据点是从多个高斯分布的混合中生成的。每个分布对应一个聚类,由其均值协方差特征化。该模型由以下内容定义:潜在变量,每个数据点与一个潜在变量相关联,指示其属于哪个高斯成分参数,模型参数包括高斯成分均值协方差混合系数。目标是从观察到的数据中估计这些参数。

变分推断变分推断提供了一种近似复杂后验分布的框架。它不是直接计算真实后验(通常计算上不可行),而是通过优化一个更简单的分布来寻求近似。关键概念包括:均场近似,假设联合分布可以因子化为独立成分,从而简化计算;证据下界(ELBO),变分推断中的优化目标是最大化ELBO,它作为观察数据边际似然的下界。这涉及最小化近似分布真实后验之间的Kullback-Leibler(KL)散度。在GMM的背景下,变分推断可以完成以下工作:

  • 参数估计:可以使用变分推断迭代更新每个高斯成分的参数。这包括根据当前数据点对聚类的分配来估计均值协方差混合比例
  • 处理不确定性:通过将参数视为分布而非固定值,VB-GMM捕捉参数估计中的不确定性,从而导致更稳定的聚类结果。
  • 可扩展性:与传统方法(如期望最大化(EM)相比,变分推断通常更具可扩展性,尤其是在处理大数据集时。

实施步骤:

  • 模型规范:定义成分(聚类)的数量及其先验分布
  • 变分分布:选择一个家族的分布来近似潜在变量和参数的后验
  • 优化:使用迭代更新最大化证据下界(ELBO)`,调整变分参数直到收敛。
  • 推断:一旦优化完成,使用变分分布对新数据点进行预测或分析聚类特征。

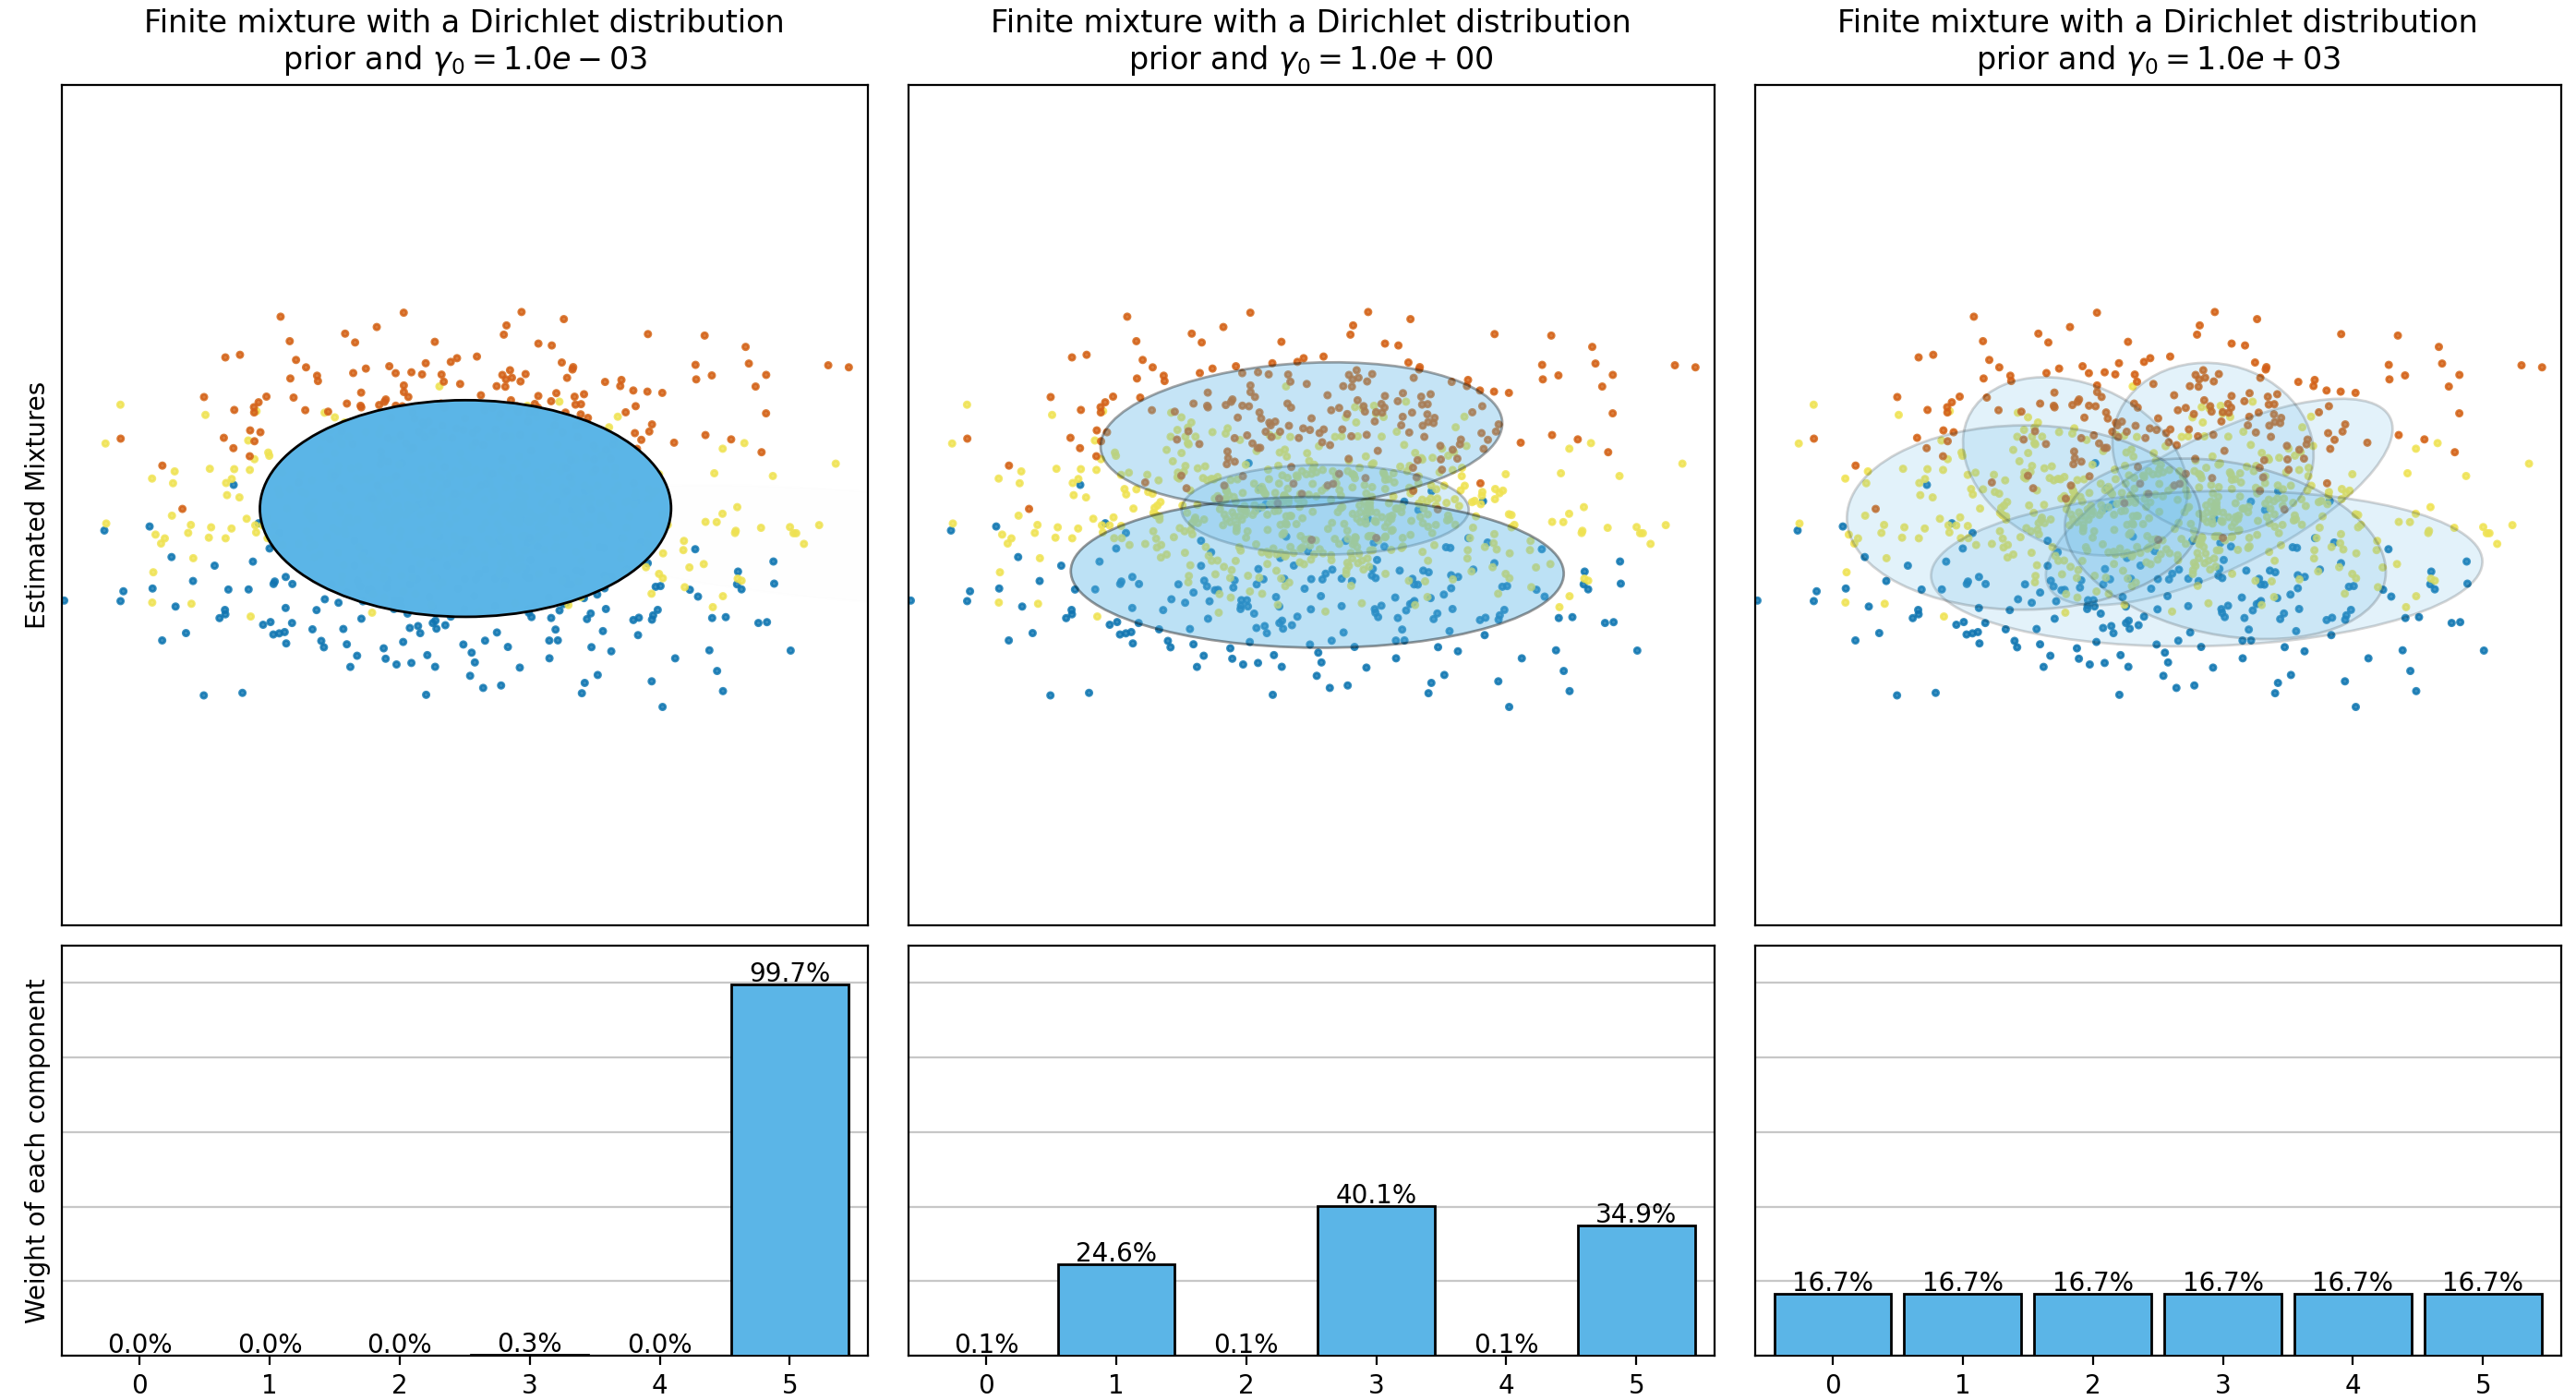
狄利克雷(Dirichlet)分布是一种连续的多元概率分布,通常用于贝叶斯统计中的先验分布。它是分类分布多项分布共轭先验,因此在处理这些类型的数据时,使用狄利克雷(Dirichlet)分布可以简化计算。狄利克雷(Dirichlet)分布是由一个正实数向量参数化,通常表示为:,它的概率密度函数(PDF)适用于维向量,其元素在区间内,并且满足(即所有元素之和为1),这使得狄利克雷(Dirichlet)分布可以被视为类分类事件的概率分布。变分贝叶斯高斯混合提出了两种权重分布的先验类型:具有狄利克雷(Dirichlet)分布有限混合模型和具有狄利克雷(Dirichlet)过程无限混合模型

共轭先验:在贝叶斯统计中,如果后验分布先验分布属于同一概率分布族,则称它们为共轭分布狄利克雷(Dirichlet)分布作为多项分布共轭先验,使得在更新后验时,计算变得更加简单。具体来说,如果我们有一个多项分布的参数,其后验分布依然是一个狄利克雷(Dirichlet)分布

对称狄利克雷(Dirichlet)分布狄利克雷(Dirichlet)分布的一个特殊情况是对称狄利克雷(Dirichlet)分布,其中参数向量的所有元素相同。在这种情况下,可以用一个标量值(浓度参数)来表示。对称情况下,当浓度参数时,对称狄利克雷(Dirichlet)分布等价于标准(K-1)-simplex上的均匀分布。当浓度参数大于1时,倾向于生成均匀分布;当小于1时,则倾向于生成稀疏分布

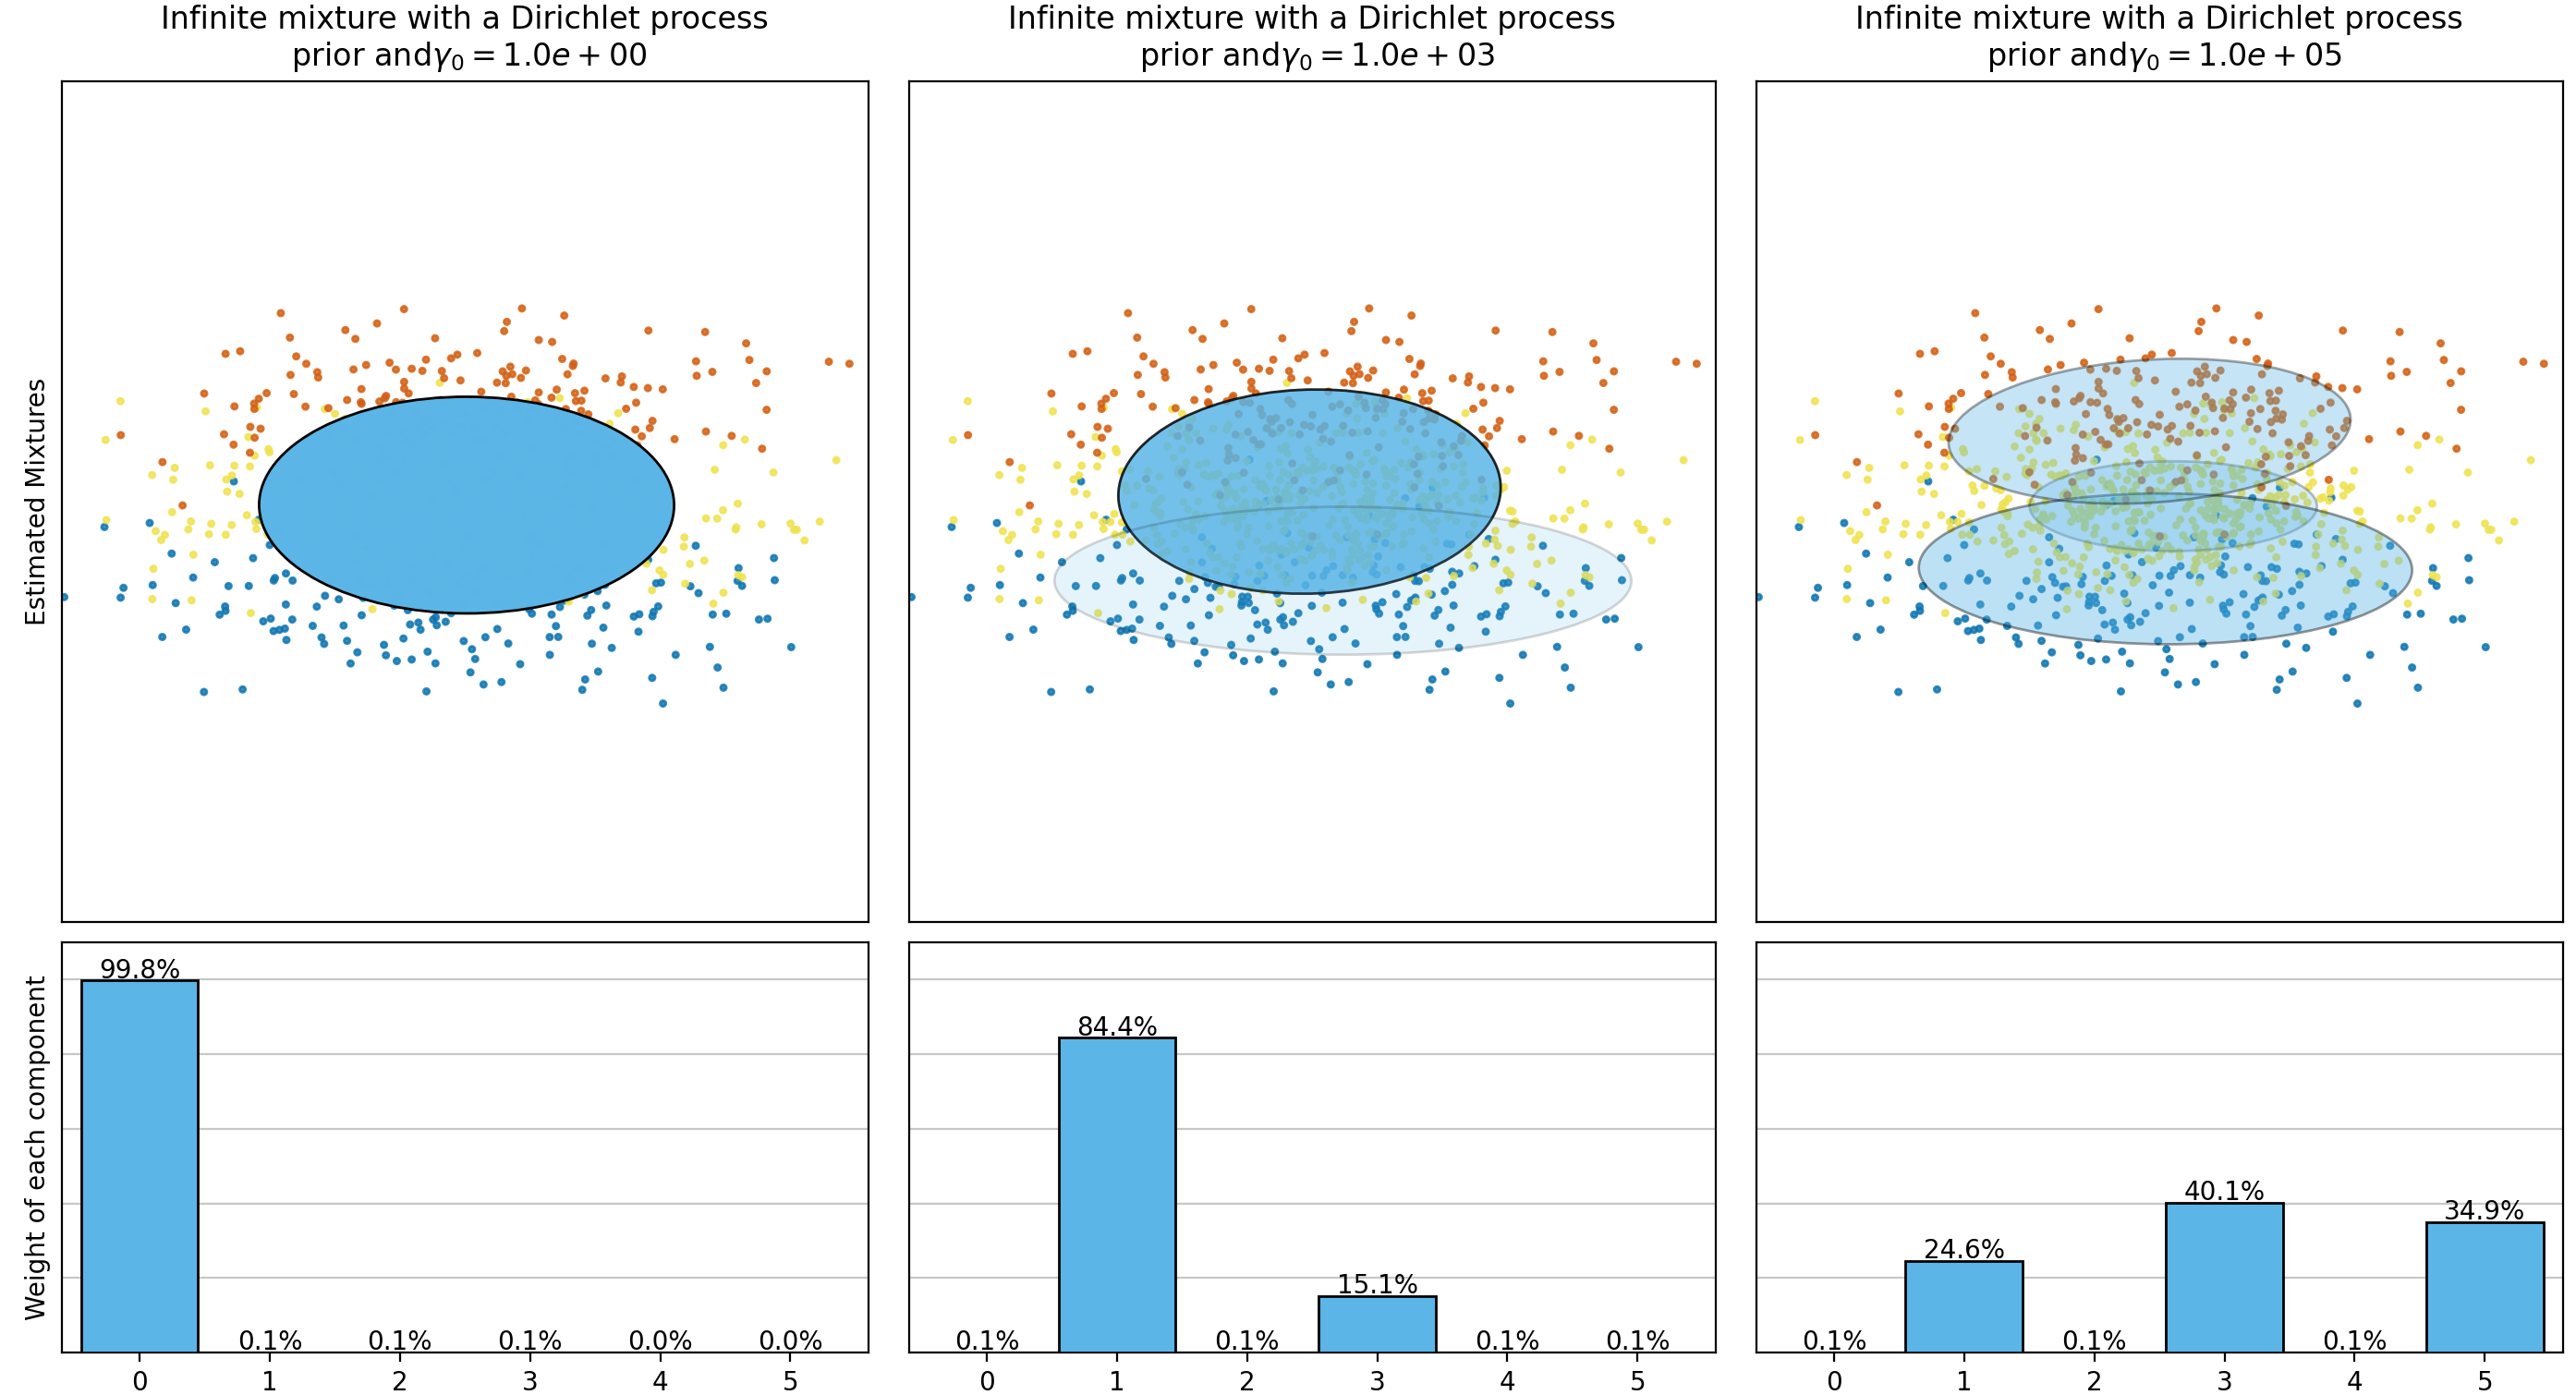
狄利克雷(Dirichlet)过程是一种重要的随机过程,广泛应用于贝叶斯非参数统计中。它的主要特点是能够生成随机概率分布,这些分布可以用于建模数据的潜在结构,尤其是在数据的类别数未知或不固定的情况下。狄利克雷(Dirichlet)过程由两个主要参构成:

  • 基准分布:这是一个概率分布,表示数据分布的先验知识。它提供了狄利克雷(Dirichlet)过程生成的分布的“中心”。
  • 浓度参数:这是一个正实数,控制生成分布的离散程度。较大的值意味着生成的分布可能包含更多的类别,而较小的值则倾向于集中在少数几个类别上。

狄利克雷(Dirichlet)过程性质和特征为:随机性,从狄利克雷(Dirichlet)过程中生成的分布几乎总是离散的,即使基准分布是连续的。这种特性使得狄利克雷(Dirichlet)过程特别适合用于聚类和混合模型;共轭先验狄利克雷(Dirichlet)过程贝叶斯推断中作为无限混合模型的共轭先验,可以有效地更新后验分布自适应性狄利克雷(Dirichlet)过程能够根据数据自动调整其复杂度,无需预先指定类别数量。这使得它在处理未知类别数的数据时非常有用。

下面是一个基于权重浓度先验类型(变分贝叶斯高斯混合)来分析数据的例子。这里会涉及到狄利克雷(Dirichlet)分布有限混合模型狄利克雷(Dirichlet)过程无限混合模型

1
2
3
4
5
6
7
8
9
10
11
12
13
14
15
16
17
18
19
20
21
22
23
24
25
26
27
28
29
30
31
32
33
34
35
36
37
38
39
40
41
42
43
44
45
46
47
48
49
50
51
52
53
54
55
56
57
58
59
60
61
62
63
64
65
66
67
68
69
70
71
72
73
74
75
76
77
78
79
80
81
82
83
84
85
86
87
88
89
90
91
92
93
94
95
96
97
98
99
import matplotlib as mpl
import matplotlib.gridspec as gridspec
import matplotlib.pyplot as plt
import numpy as np
from sklearn.mixture import BayesianGaussianMixture

def plot_ellipses(ax, weights, means, covars):
for n in range(means.shape[0]):
eig_vals, eig_vecs = np.linalg.eigh(covars[n])
unit_eig_vec = eig_vecs[0] / np.linalg.norm(eig_vecs[0])
angle = np.arctan2(unit_eig_vec[1], unit_eig_vec[0])
# Ellipse needs degrees
angle = 180 * angle / np.pi
# eigenvector normalization
eig_vals = 2 * np.sqrt(2) * np.sqrt(eig_vals)
ell = mpl.patches.Ellipse(means[n], eig_vals[0], eig_vals[1], angle=180 + angle, edgecolor="black")
ell.set_clip_box(ax.bbox)
ell.set_alpha(weights[n])
ell.set_facecolor("#56B4E9")
ax.add_artist(ell)

def plot_results(ax1, ax2, estimator, X, y, title, plot_title=False):
ax1.set_title(title)
ax1.scatter(X[:, 0], X[:, 1], s=5, marker="o", color=colors[y], alpha=0.8)
ax1.set_xlim(-2.0, 2.0)
ax1.set_ylim(-3.0, 3.0)
ax1.set_xticks(())
ax1.set_yticks(())
plot_ellipses(ax1, estimator.weights_, estimator.means_, estimator.covariances_)

ax2.get_xaxis().set_tick_params(direction="out")
ax2.yaxis.grid(True, alpha=0.7)
for k, w in enumerate(estimator.weights_):
ax2.bar(k,w,width=0.9,color="#56B4E9",zorder=3,align="center",edgecolor="black",)
ax2.text(k, w + 0.007, "%.1f%%" % (w * 100.0), horizontalalignment="center")
ax2.set_xlim(-0.6, 2 * n_components - 0.4)
ax2.set_ylim(0.0, 1.1)
ax2.tick_params(axis="y", which="both", left=False, right=False, labelleft=False)
ax2.tick_params(axis="x", which="both", top=False)

if plot_title:
ax1.set_ylabel("Estimated Mixtures")
ax2.set_ylabel("Weight of each component")

# Parameters of the dataset
random_state, n_components, n_features = 2, 3, 2
colors = np.array(["#0072B2", "#F0E442", "#D55E00"])

covars = np.array([[[0.7, 0.0], [0.0, 0.1]], [[0.5, 0.0], [0.0, 0.1]], [[0.5, 0.0], [0.0, 0.1]]])
samples = np.array([200, 500, 200])
means = np.array([[0.0, -0.70], [0.0, 0.0], [0.0, 0.70]])

# mean_precision_prior= 0.8 to minimize the influence of the prior
estimators = [
(
"Finite mixture with a Dirichlet distribution\nprior and " r"$\gamma_0=$",
BayesianGaussianMixture(
weight_concentration_prior_type="dirichlet_distribution",
n_components=2 * n_components,
reg_covar=0,
init_params="random",
max_iter=1500,
mean_precision_prior=0.8,
random_state=random_state,
),
[0.001, 1, 1000],
),
(
"Infinite mixture with a Dirichlet process\n prior and" r"$\gamma_0=$",
BayesianGaussianMixture(
weight_concentration_prior_type="dirichlet_process",
n_components=2 * n_components,
reg_covar=0,
init_params="random",
max_iter=1500,
mean_precision_prior=0.8,
random_state=random_state,
),
[1, 1000, 100000],
),
]

# Generate data
rng = np.random.RandomState(random_state)
X = np.vstack([rng.multivariate_normal(means[j], covars[j], samples[j]) for j in range(n_components)])
y = np.concatenate([np.full(samples[j], j, dtype=int) for j in range(n_components)])

# Plot results in two different figures
for title, estimator, concentrations_prior in estimators:
plt.figure(figsize=(4.7 * 3, 8))
plt.subplots_adjust(bottom=0.04, top=0.90, hspace=0.05, wspace=0.05, left=0.03, right=0.99)

gs = gridspec.GridSpec(3, len(concentrations_prior))
for k, concentration in enumerate(concentrations_prior):
estimator.weight_concentration_prior = concentration
estimator.fit(X)
plot_results(plt.subplot(gs[0:2, k]),plt.subplot(gs[2, k]),estimator,X,y,r"%s$%.1e$" % (title, concentration),plot_title=k == 0,)

plt.show()

流形学习(Manifold Learning)

流形学习(Manifold Learning)是一种非线性降维技术,旨在从高维数据中提取低维流形结构。它基于这样一个假设:高维数据通常分布在一个低维流形上,这种流形可以通过捕捉数据的内在几何特征来进行建模。流形:在数学中,流形是一个局部类似于欧几里得空间的空间。简单来说,流形可以被视为一种“曲面”,在高维空间中具有低维的特性。例如,二维球面是三维空间中的一个流形高维数据:许多实际应用中的数据(如图像、文本、音频等)通常位于高维空间中。流形学习的目标是找到这些高维数据的低维表示,同时尽可能保留数据的结构和特征。流形学习包含多种算法和技术,如主成分分析(PCA)、t-分布随机邻域嵌入(t-SNE)、等距映射(Isomap)、局部线性嵌入(LLE)、多维尺度分析(MDS)、Hessian特征映射(HLLE)、谱嵌入(Spectral Embedding)、统一流形近似与投影(UMAP)等。

主成分分析(PCA)

主成分分析(Principal Component Analysis, PCA)是一种常用的线性降维技术,旨在通过提取数据中的主要特征来减少数据的维度,同时尽可能保留原始数据的变异性。主成分分析(PCA)在数据预处理特征提取可视化等领域中广泛应用。主成分分析(PCA)原理:主成分分析(PCA)的核心思想是将高维数据投影到低维空间中,使得投影后的数据在新的坐标系中具有最大的方差。具体步骤如下:
标准化数据:首先对数据进行标准化处理,确保每个特征的均值0方差1。这一步是为了消除不同特征之间的量纲影响
计算协方差矩阵:计算标准化后数据的协方差矩阵 ,其公式为:。其中是标准化后的数据矩阵,是样本数量。

  • 特征值分解:对协方差矩阵进行特征值分解,得到特征值和对应的特征向量。特征值表示每个主成分所解释的方差大小,而特征向量则表示新坐标系的方向。
  • 选择主成分:根据特征值的大小选择前主成分,这些主成分对应于最大的特征值
  • 转换数据:将原始数据投影到选定的主成分上,得到降维后的数据表示。

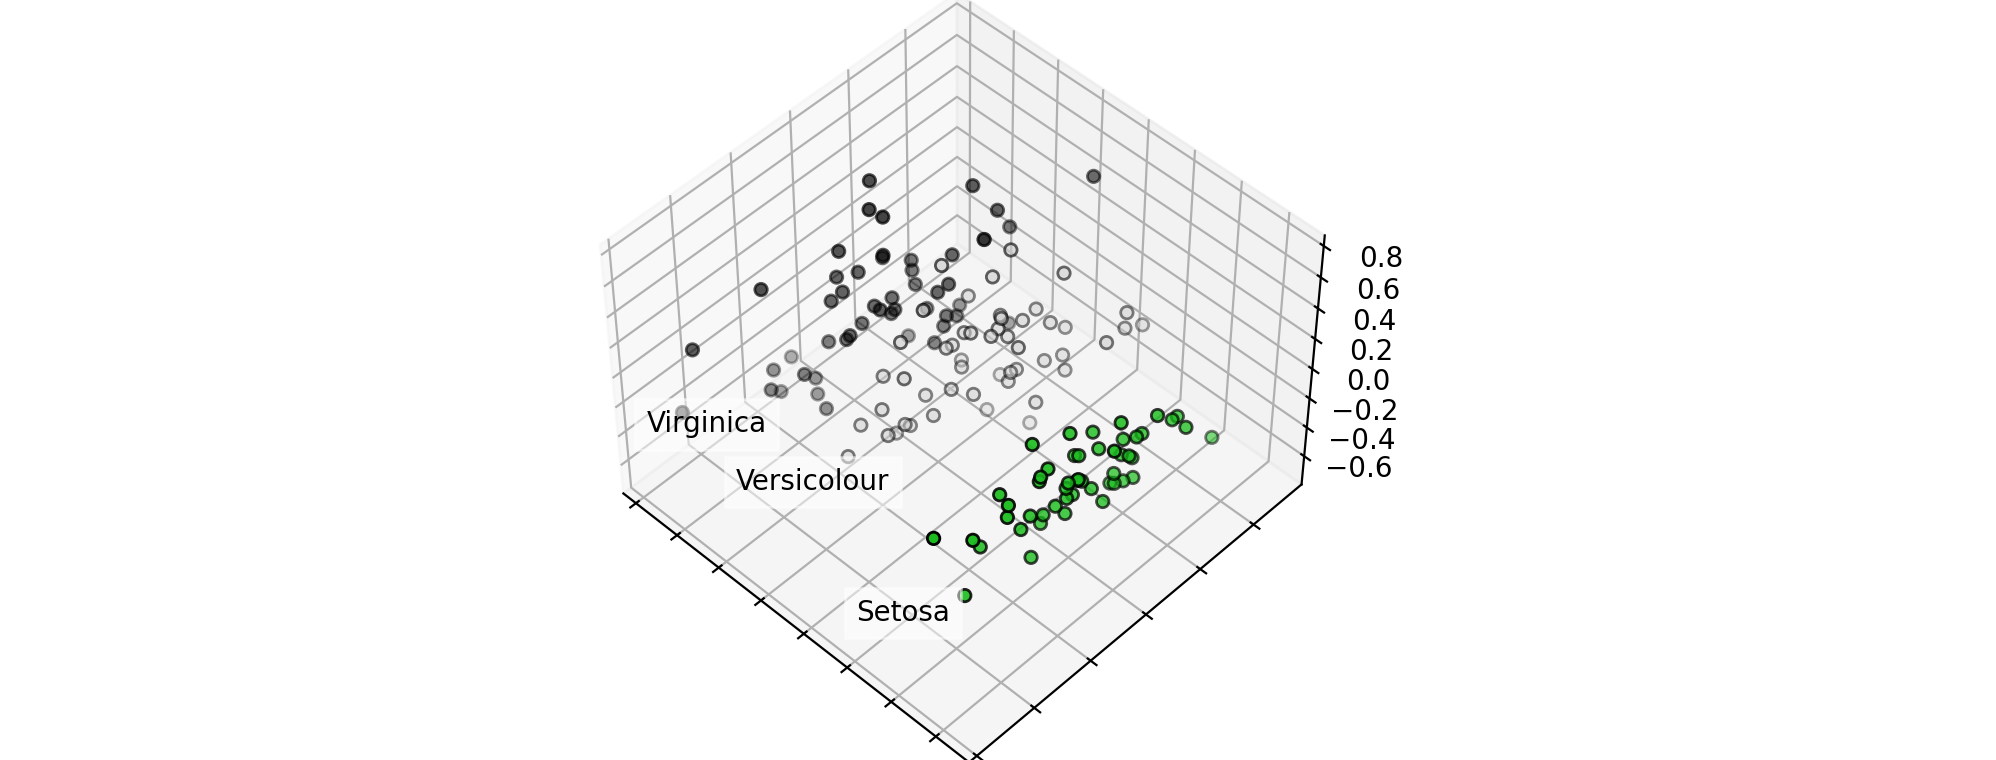
下面是鸢尾花数据集的一个示例,它由4个特征组成,投影在可以解释最大方差的2个维度上:

1
2
3
4
5
6
7
8
9
10
11
12
13
14
15
16
17
18
19
20
21
22
23
24
25
26
27
28
29
30
31
32
33
34
import matplotlib.pyplot as plt
import mpl_toolkits.mplot3d
import numpy as np
from sklearn import datasets, decomposition

np.random.seed(5)

iris = datasets.load_iris()
X = iris.data
y = iris.target

fig = plt.figure(1, figsize=(4, 3))
plt.clf()

ax = fig.add_subplot(111, projection="3d", elev=48, azim=134)
ax.set_position([0, 0, 0.95, 1])

plt.cla()
pca = decomposition.PCA(n_components=3)
pca.fit(X)
X = pca.transform(X)

for name, label in [("Setosa", 0), ("Versicolour", 1), ("Virginica", 2)]:
ax.text3D(X[y == label, 0].mean(),X[y == label, 1].mean() + 1.5,X[y == label, 2].mean(),name,horizontalalignment="center",
bbox=dict(alpha=0.5, edgecolor="w", facecolor="w"),)

# Reorder the labels to have colors matching the cluster results
y = np.choose(y, [1, 2, 0]).astype(float)
ax.scatter(X[:, 0], X[:, 1], X[:, 2], c=y, cmap=plt.cm.nipy_spectral, edgecolor="k")

ax.xaxis.set_ticklabels([])
ax.yaxis.set_ticklabels([])

plt.show()
增量主成分分析(IPCA)

增量主成分分析(IPCA)是一种用于处理大规模数据集的降维技术,特别适合于不能一次性加载到内存中的数据。与传统的主成分分析(PCA)不同,增量主成分分析(IPCA)允许逐步更新模型,通过分批处理数据来实现高效的计算。增量主成分分析(IPCA)基本原理:数据分批处理,将大数据集划分为多个小批次,每次只处理一个批次的数据。这种方式使得内存使用量与输入数据样本数量无关,而是与特征数量相关;更新模型,每当新的一批数据到达时,使用当前模型的状态(如主成分协方差矩阵)来更新主成分。这通常涉及到对当前主成分进行调整,以反映新数据的影响;特征值和特征向量计算,通过对当前的协方差矩阵进行特征值分解,提取新的主成分

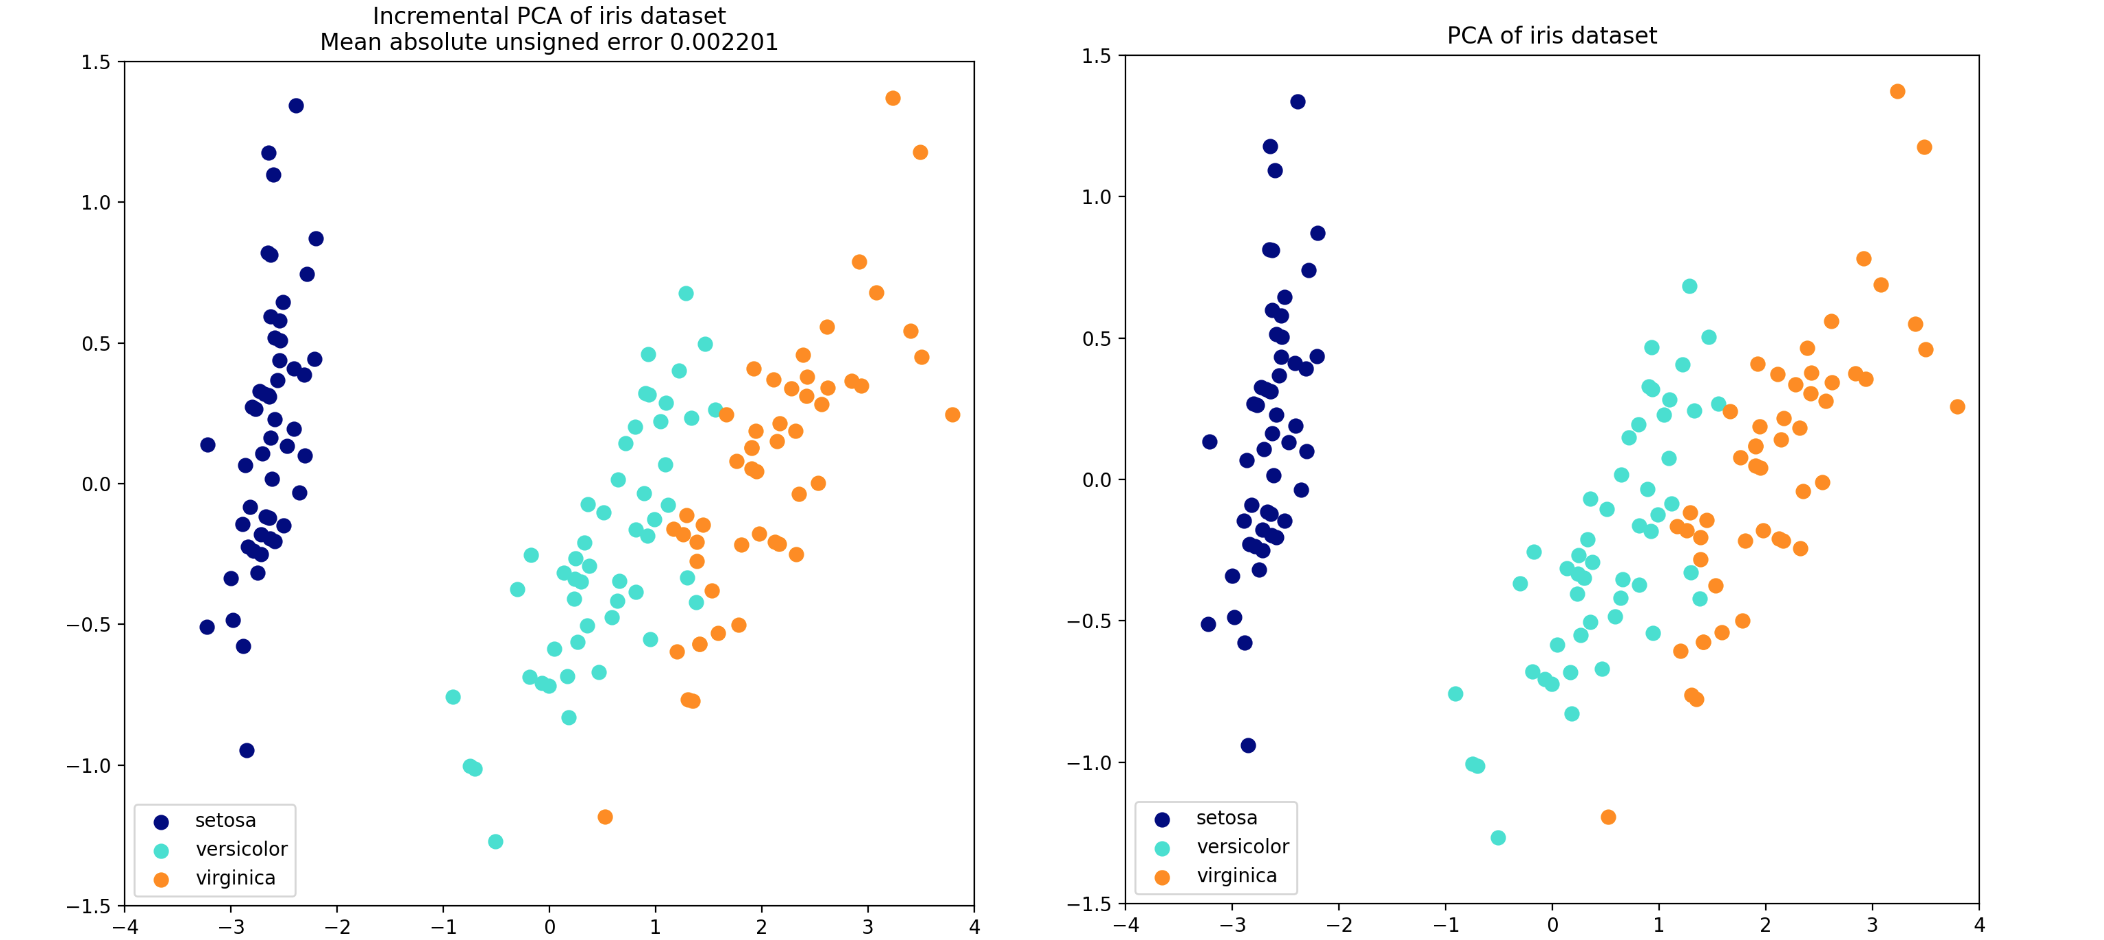
当要分解的数据集太大而无法装入内存时,增量主成分分析(IPCA)通常用于替代主成分分析(PCA)。增量主成分分析(IPCA)使用与输入数据样本数量无关的内存量为输入数据构建低秩近似。它仍然依赖于输入数据特征,但更改批处理大小可以控制内存使用量。此示例可直观地检查增量主成分分析(IPCA)是否能够找到与主成分分析(PCA)相似的数据投影(符号翻转),增量主成分分析(IPCA)适用于无法装入内存的大型数据集,这时需要增量方法。

1
2
3
4
5
6
7
8
9
10
11
12
13
14
15
16
17
18
19
20
21
22
23
24
25
26
27
28
29
30
31
32
import matplotlib.pyplot as plt
import numpy as np
from sklearn.datasets import load_iris
from sklearn.decomposition import PCA, IncrementalPCA

iris = load_iris()
X = iris.data
y = iris.target

n_components = 2
ipca = IncrementalPCA(n_components=n_components, batch_size=10)
X_ipca = ipca.fit_transform(X)

pca = PCA(n_components=n_components)
X_pca = pca.fit_transform(X)

colors = ["navy", "turquoise", "darkorange"]

for X_transformed, title in [(X_ipca, "Incremental PCA"), (X_pca, "PCA")]:
plt.figure(figsize=(8, 8))
for color, i, target_name in zip(colors, [0, 1, 2], iris.target_names):
plt.scatter(X_transformed[y == i, 0],X_transformed[y == i, 1],color=color,lw=2,label=target_name,)

if "Incremental" in title:
err = np.abs(np.abs(X_pca) - np.abs(X_ipca)).mean()
plt.title(title + " of iris dataset\nMean absolute unsigned error %.6f" % err)
else:
plt.title(title + " of iris dataset")
plt.legend(loc="best", shadow=False, scatterpoints=1)
plt.axis([-4, 4, -1.5, 1.5])

plt.show()
随机奇异值分解的主成分分析(PCA using Randomized SVD)

随机奇异值分解(Randomized SVD)是一种高效的算法,用于执行主成分分析(PCA),特别是在处理大规模数据集时。与传统的主成分分析(PCA)方法相比,随机奇异值分解(Randomized SVD)可以显著减少计算时间和内存使用。主成分分析(PCA)的目标是通过提取数据中主要的方差方向来降低数据维度。随机奇异值分解(Randomized SVD)通过引入随机化技术来加速这一过程,具体步骤如下:

  • 数据预处理:首先,对数据进行中心化,即减去每个特征的均值
  • 构建随机投影:生成一个随机矩阵,通常是高斯随机矩阵,将原始数据投影到一个较小的子空间中。这一步骤减少了需要处理的数据量。
  • 计算SVD:对投影后的数据执行标准的奇异值分解,得到奇异值和对应的奇异向量。这些奇异向量用于构建主成分分析(PCA)的主成分。
  • 选择主成分:根据奇异值选择前个主成分,这些主成分对应于最大方差方向。

通过删除与较低奇异值相关的分量的奇异向量,将数据投影到保留大部分方差的低维空间通常很有趣。例如使用像素灰度图片进行人脸识别,数据的维数为4096,在如此宽的数据上训练RBF支持向量机的速度很慢。此外,数据的固有维数远低于4096,因为所有人脸图片看起来都有些相似。样本位于维数低得多的流形上(例如大约200)。主成分分析(PCA)算法可用于线性变换数据,同时降低维数并同时保留大部分方差。例如,下图显示了Olivetti数据集中的16个样本肖像(以0.0为中心)。右侧是重新流形为肖像的前16奇异向量。由于我们只需数据集前16奇异向量样本大小为且特征数为,计算时间小于1s。注意,则其时间复杂度为而不是

下边是一个人脸识别的例子,使用Olivetti人脸数据集,使用奇异值分解(SVD)对数据进行线性降维,将其投影到较低维空间中。

1
2
3
4
5
6
7
8
9
10
11
12
13
14
15
16
17
18
19
20
21
22
23
24
25
26
27
28
29
30
31
32
33
34
35
36
37
38
39
40
41
42
43
44
45
46
import logging
import matplotlib.pyplot as plt
from numpy.random import RandomState
from sklearn import cluster, decomposition
from sklearn.datasets import fetch_olivetti_faces

rng = RandomState(0)

# Display progress logs on stdout
logging.basicConfig(level=logging.INFO, format="%(asctime)s %(levelname)s %(message)s")

# 加载并预处理Olivetti人脸数据集
faces, _ = fetch_olivetti_faces(return_X_y=True, shuffle=True, random_state=rng)
n_samples, n_features = faces.shape

# Global centering (focus on one feature, centering all samples)
faces_centered = faces - faces.mean(axis=0)

# Local centering (focus on one sample, centering all features)
faces_centered -= faces_centered.mean(axis=1).reshape(n_samples, -1)

# print("Dataset consists of %d faces" % n_samples)
n_row, n_col = 2, 3
n_components = n_row * n_col
image_shape = (64, 64)

# 定义一个函数来绘制面部图
def plot_gallery(title, images, n_col=n_col, n_row=n_row, cmap=plt.cm.gray):
fig, axs = plt.subplots(nrows=n_row,ncols=n_col,figsize=(2.0 * n_col, 2.3 * n_row),facecolor="white",constrained_layout=True,)
fig.set_constrained_layout_pads(w_pad=0.01, h_pad=0.02, hspace=0, wspace=0)
fig.set_edgecolor("black")
fig.suptitle(title, size=16)
for ax, vec in zip(axs.flat, images):
vmax = max(vec.max(), -vec.min())
im = ax.imshow(vec.reshape(image_shape),cmap=cmap,interpolation="nearest",vmin=-vmax,vmax=vmax,)
ax.axis("off")

fig.colorbar(im, ax=axs, orientation="horizontal", shrink=0.99, aspect=40, pad=0.01)
plt.show()

plot_gallery("Faces from dataset", faces_centered[:n_components])

# 使用随机奇异值分解(SVD)对数据进行线性降维,将其投影到较低维空间
pca_estimator = decomposition.PCA(n_components=n_components, svd_solver="randomized", whiten=True)
pca_estimator.fit(faces_centered)
plot_gallery("Eigenfaces - PCA using randomized SVD", pca_estimator.components_[:n_components])
稀疏主成分分析(SPCA)

稀疏主成分分析(SPCA)是一种统计方法,旨在在保留数据主要特征的同时,增强结果的可解释性。与传统的主成分分析(PCA)相比,稀疏主成分分析(SPCA)通过引入稀疏性,使得主成分的系数大多数为0,从而突出主要变量,减少冗余信息。稀疏主成分分析(SPCA)在主成分分析(PCA)的基础上,引入了稀疏性,通过优化目标中的L1正则化项,使得大部分系数变为0。这种方法不仅保留了数据的主要特征,还提高了结果的可解释性,因为它强调了对结果影响最大的变量。主成分分析(PCA)的缺点是,通过该方法提取的成分具有完全密集的表达式,当它们表示为原始变量的线性组合时,它们具有非零系数。这可能使解释变得困难。在许多情况下,真实的底层成分可以想象为稀疏向量;例如在人脸识别中,成分可能自然地映射到面部的各个部分。稀疏主成分产生更简约、更易于解释的表示,清楚地强调哪些原始特征导致了样本之间的差异。

以下示例使用稀疏主成分分析(SPCA)从Olivetti人脸数据集中提取16个成分,使用像素灰度图片进行人脸识别,数据的维数为4096

1
2
3
4
5
6
7
8
9
10
11
12
13
14
15
16
17
18
19
20
21
22
23
24
25
26
27
28
29
30
31
32
33
34
35
36
37
38
39
40
41
42
43
44
45
46
47
48
49
import logging
import matplotlib.pyplot as plt
from numpy.random import RandomState
from sklearn import cluster, decomposition
from sklearn.datasets import fetch_olivetti_faces

rng = RandomState(0)

# Display progress logs on stdout
logging.basicConfig(level=logging.INFO, format="%(asctime)s %(levelname)s %(message)s")

# 加载并预处理Olivetti人脸数据集
faces, _ = fetch_olivetti_faces(return_X_y=True, shuffle=True, random_state=rng)
n_samples, n_features = faces.shape

# Global centering (focus on one feature, centering all samples)
faces_centered = faces - faces.mean(axis=0)

# Local centering (focus on one sample, centering all features)
faces_centered -= faces_centered.mean(axis=1).reshape(n_samples, -1)

# print("Dataset consists of %d faces" % n_samples)
n_row, n_col = 2, 3
n_components = n_row * n_col
image_shape = (64, 64)

# 定义一个函数来绘制面部图
def plot_gallery(title, images, n_col=n_col, n_row=n_row, cmap=plt.cm.gray):
fig, axs = plt.subplots(nrows=n_row,ncols=n_col,figsize=(2.0 * n_col, 2.3 * n_row),facecolor="white",constrained_layout=True,)
fig.set_constrained_layout_pads(w_pad=0.01, h_pad=0.02, hspace=0, wspace=0)
fig.set_edgecolor("black")
fig.suptitle(title, size=16)
for ax, vec in zip(axs.flat, images):
vmax = max(vec.max(), -vec.min())
im = ax.imshow(vec.reshape(image_shape),cmap=cmap,interpolation="nearest",vmin=-vmax,vmax=vmax,)
ax.axis("off")

fig.colorbar(im, ax=axs, orientation="horizontal", shrink=0.99, aspect=40, pad=0.01)
plt.show()

# 使用随机奇异值分解(SVD)对数据进行线性降维,将其投影到较低维空间
pca_estimator = decomposition.PCA(n_components=n_components, svd_solver="randomized", whiten=True)
pca_estimator.fit(faces_centered)
plot_gallery("Eigenfaces - PCA using randomized SVD", pca_estimator.components_[:n_components])

# 使用小批量稀疏主成分分析(SPCA)对数据进行先线性降维,将其投影到较低维空间
batch_pca_estimator = decomposition.MiniBatchSparsePCA(n_components=n_components, alpha=0.1, max_iter=100, batch_size=3, random_state=rng)
batch_pca_estimator.fit(faces_centered)
plot_gallery("Sparse components - MiniBatchSparsePCA",batch_pca_estimator.components_[:n_components],)
核主成分分析(KPCA)

核主成分分析(KPCA)是一种扩展的主成分分析(PCA)技术,旨在处理非线性数据。与传统的PCA不同,核主成分分析(KPCA)通过引入核函数将数据映射到高维特征空间,从而能够在这个空间中进行线性降维核主成分分析(KPCA)原理是利用核函数将原始数据映射到高维特征空间,使得在低维空间中非线性可分的数据在高维空间中变得线性可分。具体步骤如下:

  • 计算核矩阵:使用核函数计算每对样本之间的相似度,形成核矩阵
  • 中心化核矩阵:将核矩阵中的每个元素减去均值,以确保数据在高维空间中的中心为0
  • 特征值分解:对中心化后的核矩阵进行特征值分解,提取特征向量特征值
  • 选择主成分:根据特征值的大小选择前个主成分。
  • 投影:将原始数据集投影到选定的主成分上,从而得到降维后的数据。

核主成分分析(KPCA)的特征求解器包括:随机求解器密集求解器arpack求解器。接下来举一个例子主成分分析(PCA)和核主成分分析(KPCA)投影数据的比较:
1
2
3
4
5
6
7
8
9
10
11
12
13
14
15
16
17
18
19
20
21
22
23
24
25
26
27
28
29
30
from sklearn.datasets import make_circles
from sklearn.model_selection import train_test_split
import matplotlib.pyplot as plt
from sklearn.decomposition import PCA, KernelPCA

X, y = make_circles(n_samples=1_000, factor=0.3, noise=0.05, random_state=0)
X_train, X_test, y_train, y_test = train_test_split(X, y, stratify=y, random_state=0)
_, (train_ax, test_ax) = plt.subplots(ncols=2, sharex=True, sharey=True, figsize=(8, 4))

pca = PCA(n_components=2)
kernel_pca = KernelPCA(n_components=None, kernel="rbf", gamma=10, fit_inverse_transform=True, alpha=0.1)
X_test_pca = pca.fit(X_train).transform(X_test)
X_test_kernel_pca = kernel_pca.fit(X_train).transform(X_test)

fig, (orig_data_ax, pca_proj_ax, kernel_pca_proj_ax) = plt.subplots( ncols=3, figsize=(14, 4))
orig_data_ax.scatter(X_test[:, 0], X_test[:, 1], c=y_test)
orig_data_ax.set_ylabel("Feature #1")
orig_data_ax.set_xlabel("Feature #0")
orig_data_ax.set_title("Testing data")

pca_proj_ax.scatter(X_test_pca[:, 0], X_test_pca[:, 1], c=y_test)
pca_proj_ax.set_ylabel("Principal component #1")
pca_proj_ax.set_xlabel("Principal component #0")
pca_proj_ax.set_title("Projection of testing data\n using PCA")

kernel_pca_proj_ax.scatter(X_test_kernel_pca[:, 0], X_test_kernel_pca[:, 1], c=y_test)
kernel_pca_proj_ax.set_ylabel("Principal component #1")
kernel_pca_proj_ax.set_xlabel("Principal component #0")
kernel_pca_proj_ax.set_title("Projection of testing data\n using KernelPCA")
plt.show()

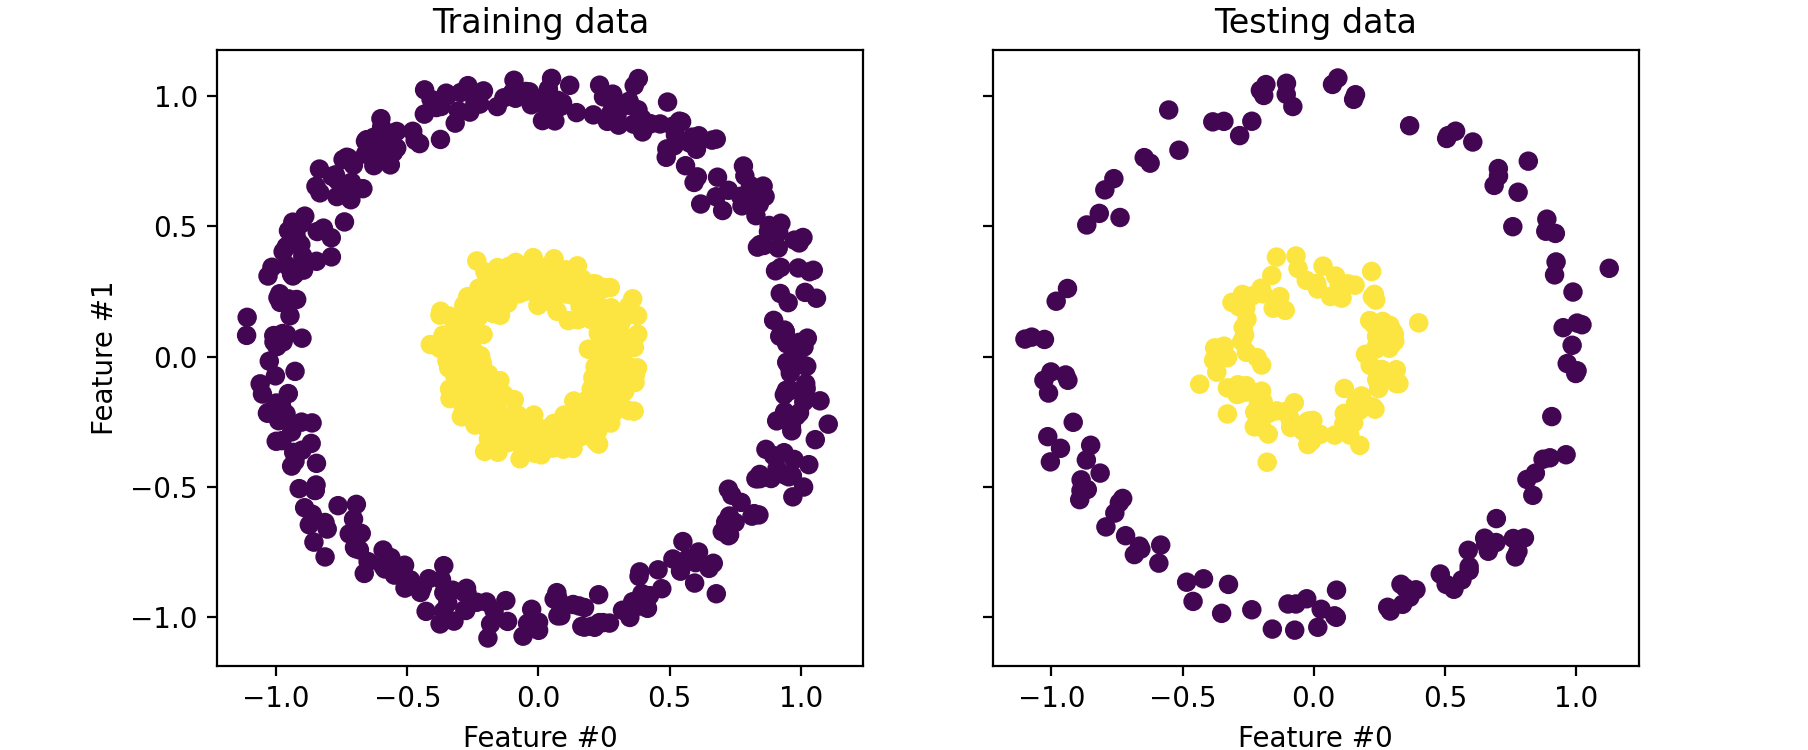
PCA线性变换数据导致坐标系将居中,根据其方差在每个分量上重新缩放,再旋转。从而获得的数据,各向是同性的且投影到其主成分上。使用PCA的投影(即中间图),我们发现缩放没有变化;实际上,数据是两个以0为中心的同心圆,原始数据已经是各向同性的。但是,数据已经旋转。如果定义一个线性分类器来区分两个类别的样本,这样的投影将将无法区分。使用核可以进行非线性投影。通过使用RBF投影将展开数据集,同时保留原始空间中彼此接近的数据点的相对距离。在右图中发现给定类的样本彼此之间的距离比来自相反类的样本之间的距离更近,从而解开了两个样本集。现在可以使用线性分类器将样本从两个类中分离出来。

主成分分析(PCA)和核主成分分析(KPCA)可以投影到原始特征空间中进行重建

1
2
3
4
5
6
7
8
9
10
11
12
13
14
15
16
17
18
19
20
21
22
23
24
25
26
27
28
29
30
from sklearn.datasets import make_circles
from sklearn.model_selection import train_test_split
import matplotlib.pyplot as plt
from sklearn.decomposition import PCA, KernelPCA

X, y = make_circles(n_samples=1_000, factor=0.3, noise=0.05, random_state=0)
X_train, X_test, y_train, y_test = train_test_split(X, y, stratify=y, random_state=0)

pca = PCA(n_components=2)
kernel_pca = KernelPCA(n_components=None, kernel="rbf", gamma=10, fit_inverse_transform=True, alpha=0.1)
X_test_pca = pca.fit(X_train).transform(X_test)
X_test_kernel_pca = kernel_pca.fit(X_train).transform(X_test)

X_reconstructed_pca = pca.inverse_transform(pca.transform(X_test))
X_reconstructed_kernel_pca = kernel_pca.inverse_transform(kernel_pca.transform(X_test))
fig, (orig_data_ax, pca_back_proj_ax, kernel_pca_back_proj_ax) = plt.subplots(ncols=3, sharex=True, sharey=True, figsize=(13, 4))

orig_data_ax.scatter(X_test[:, 0], X_test[:, 1], c=y_test)
orig_data_ax.set_ylabel("Feature #1")
orig_data_ax.set_xlabel("Feature #0")
orig_data_ax.set_title("Original test data")

pca_back_proj_ax.scatter(X_reconstructed_pca[:, 0], X_reconstructed_pca[:, 1], c=y_test)
pca_back_proj_ax.set_xlabel("Feature #0")
pca_back_proj_ax.set_title("Reconstruction via PCA")

kernel_pca_back_proj_ax.scatter(X_reconstructed_kernel_pca[:, 0], X_reconstructed_kernel_pca[:, 1], c=y_test)
kernel_pca_back_proj_ax.set_xlabel("Feature #0")
kernel_pca_back_proj_ax.set_title("Reconstruction via KernelPCA")
plt.show()
截断奇异值分解(TSVD)和潜在语义分析(LSA)

截断奇异值分解(TSVD)和潜在语义分析(LSA)是两种在数据分析自然语言处理领域中常用的技术。它们之间有着密切的联系,尤其是在处理文本数据时。

截断奇异值分解(TSVD)是一种矩阵分解技术,用于将一个矩阵分解为其组成部分,以降低数据的维度,同时保留最重要的特征。其基本步骤如下:奇异值分解(SVD),首先,对原始矩阵进行奇异值分解,得到三个矩阵。其中是左奇异向量矩阵,是对角矩阵,包含奇异值。是右奇异向量矩阵;截断操作,选择前个最大的奇异值,并相应地截取的前列,从而得到一个低秩近似矩阵。这种低秩近似有助于减少计算复杂度并去除噪声;应用截断奇异值分解(TSVD)广泛应用于图像处理推荐系统信息检索等领域,通过保留最重要的信息来提高模型的性能。

潜在语义分析(LSA)是一种自然语言处理技术,旨在通过分析文档和术语之间的关系来发现隐藏的语义结构。其主要步骤包括:构建词项-文档矩阵,将文档集合转换为一个矩阵,其中行表示词项,列表示文档,单元格包含相应的词频加权值;应用TSVD,对构建的词项-文档矩阵使用截断奇异值分解(TSVD)。通过保留前奇异值和对应的向量,可以降低维度,从而提取出潜在的主题概念语义比较,通过计算文档之间的余弦相似度,可以比较不同文档的相似性,从而实现信息检索、文本分类等任务。

截断奇异值分解(TSVD)与潜在语义分析(LSA)的关系包括:

  • 数学基础潜在语义分析(LSA)依赖于截断奇异值分解(TSVD)来实现其降维功能。通过对词项-文档矩阵进行截断奇异值分解(TSVD),潜在语义分析(LSA)能够提取出潜在的主题结构,并将文本数据转换为更易处理的形式。
  • 降噪效果:使用截断奇异值分解(TSVD)进行降维可以去除不重要的信息,从而提高潜在语义分析(LSA)模型对文本数据的理解能力。
  • 应用场景:两者结合在许多领域中都有应用,如自动文档分类、信息检索和推荐系统等。

截断奇异值分解(TSVD)和潜在语义分析(LSA)是现代数据分析中不可或缺的工具。通过有效地处理高维数据,可以揭示数据中的潜在结构关系,为信息检索和自然语言处理提供了强大的支持。

字典学习(Dictionary Learning)

字典学习(Dictionary Learning)是一种重要的机器学习技术,主要用于信号处理、图像分析和模式识别等领域。它的核心目标是从输入数据中学习一个字典,使得数据可以用该字典中的原子进行稀疏表示字典学习(Dictionary Learning)的原理为:字典构建阶段,在这一阶段,算法尝试从训练数据中学习一个最优字典。这个字典由多个原子(或特征)组成,每个原子可以看作是对输入数据的一种基础表示。常用的算法包括K-SVD(K-singular value decomposition)、正交匹配追踪(OMP)等,这些算法旨在最小化重构误差,即通过字典重构原始数据时的误差;稀疏编码阶段,一旦字典被学习到,接下来的任务是利用这个字典对新数据进行稀疏表示。新数据将表示为字典原子的线性组合,其中大多数系数为0稀疏表示有助于降低数据的冗余度,提高模型的效率和性能。

字典学习(Dictionary Learning)是一种强大的工具,通过学习适合特定数据集的字典,可以有效地进行数据降维特征提取。随着深度学习的发展,结合深度神经网络的方法也逐渐成为研究热点,使得字典学习(Dictionary Learning)能够处理更加复杂的数据结构。

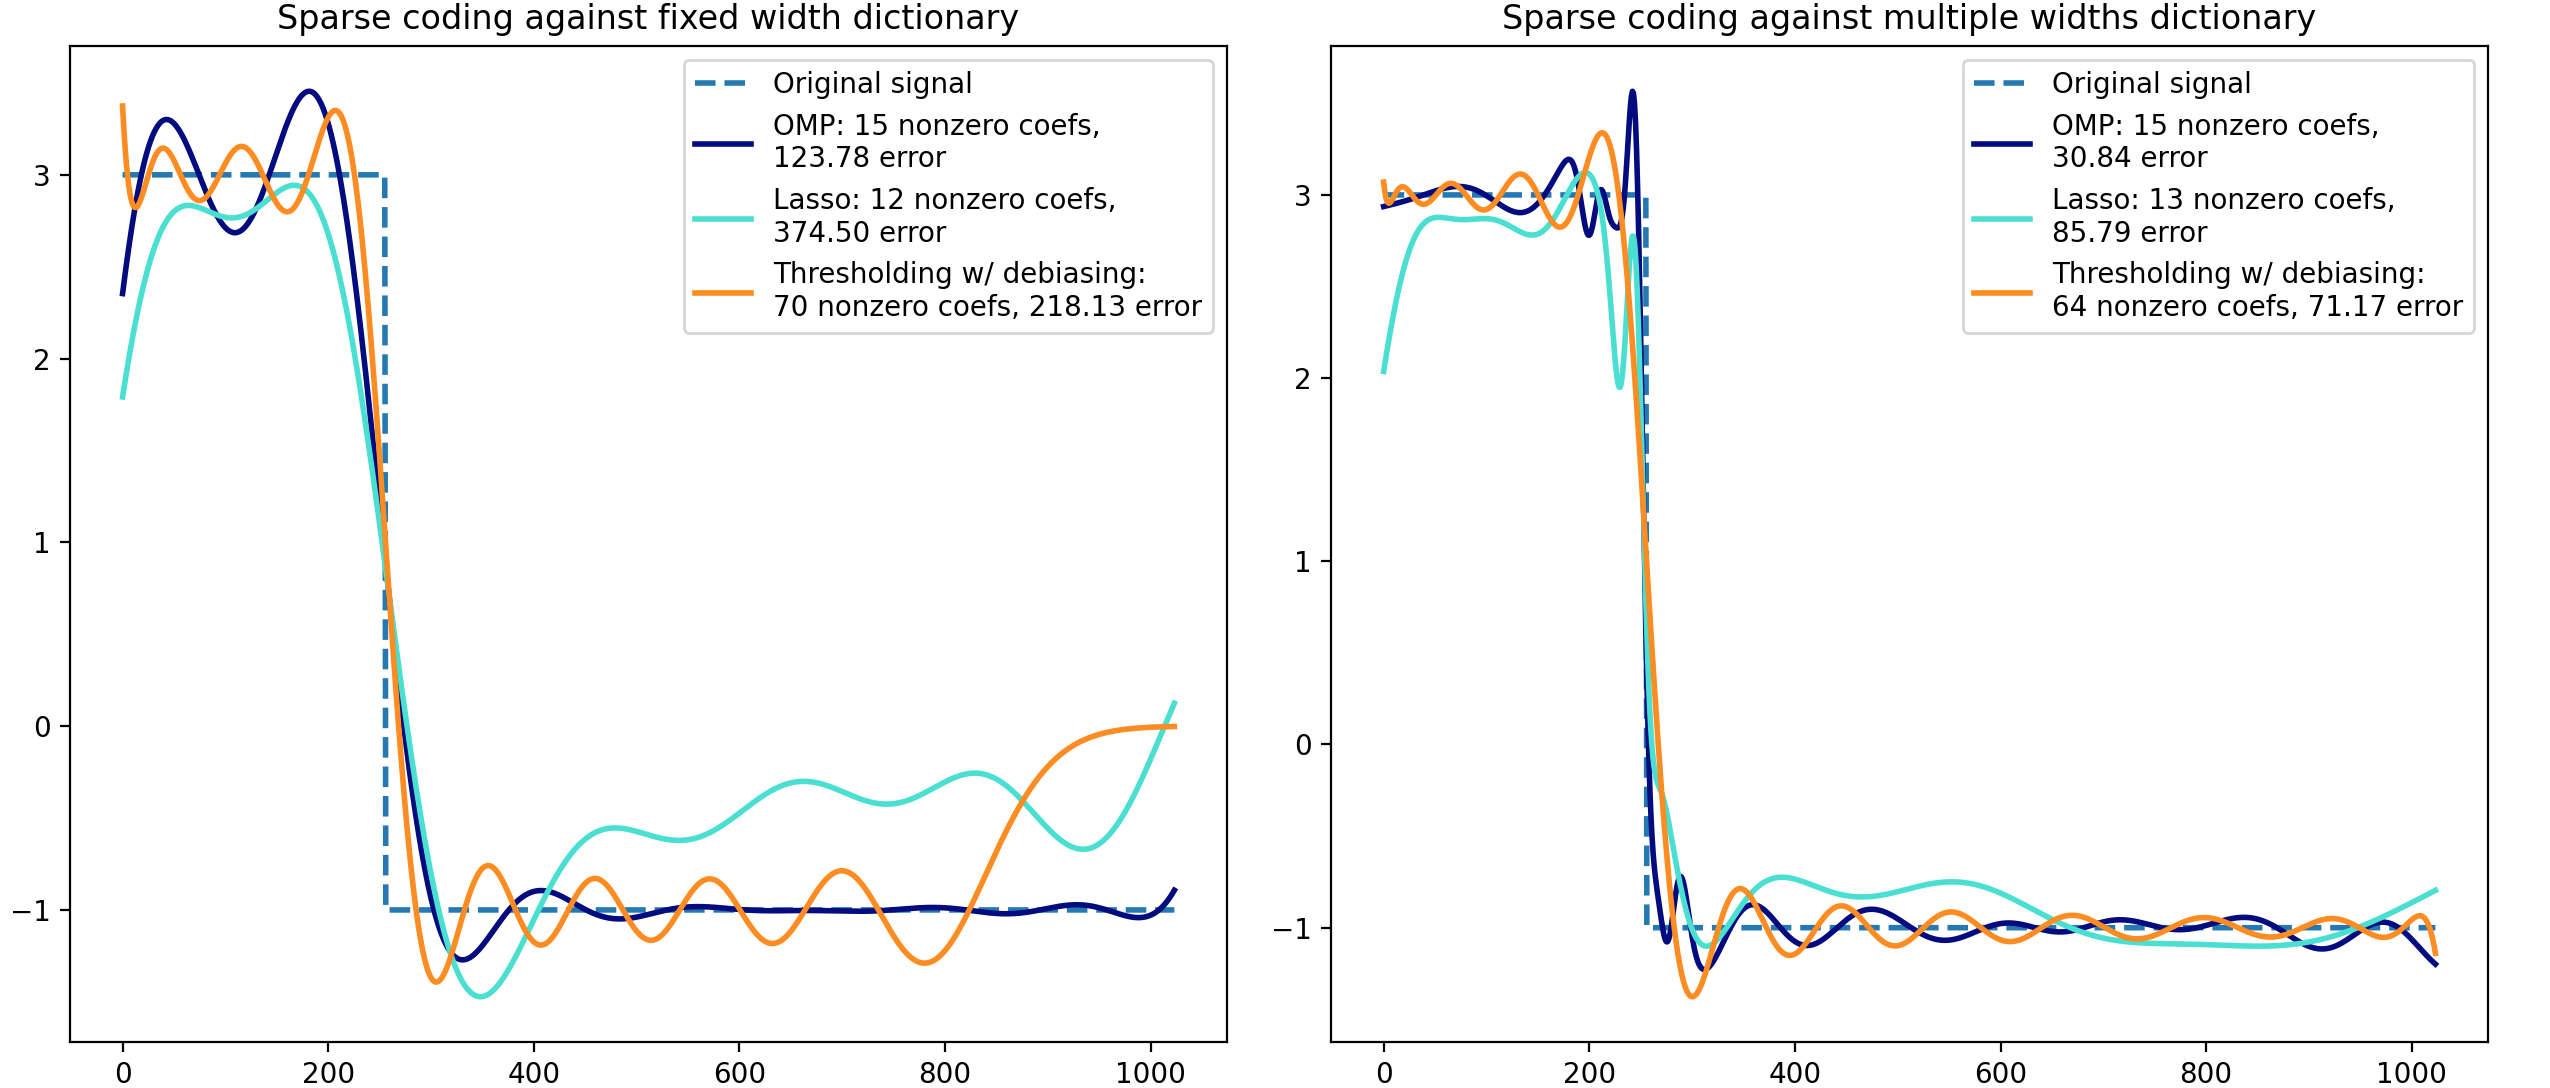
举例说明利用计算好的字典进行稀疏编码,将信号转换为Ricker(称高斯的二阶导数)小波稀疏组合。示例使用SparseCoder(sklearn)估计器比较了不同的稀疏编码方法。Ricker并不是一个特别好的内核,无法表示分段常数信号。可以看出添加不同宽度的原子有多重要,它激励学习字典使用最适合的信号类型。如下图所示,右边使用了更重的子采样。

1
2
3
4
5
6
7
8
9
10
11
12
13
14
15
16
17
18
19
20
21
22
23
24
25
26
27
28
29
30
31
32
33
34
35
36
37
38
39
40
41
42
43
44
45
46
47
48
49
50
51
52
53
54
55
56
57
58
59
60
61
62
63
64
65
66
67
68
69
70
71
72
import numpy as np
import matplotlib.pyplot as plt
from sklearn.decomposition import SparseCoder

def ricker_function(resolution, center, width):
"""Discrete sub-sampled Ricker (Mexican hat) wavelet"""
x = np.linspace(0, resolution - 1, resolution)
x = ((2 / (np.sqrt(3 * width) * np.pi**0.25))* (1 - (x - center) ** 2 / width**2) * np.exp(-((x - center) ** 2) / (2 * width**2)))
return x

def ricker_matrix(width, resolution, n_components):
"""Dictionary of Ricker (Mexican hat) wavelets"""
centers = np.linspace(0, resolution - 1, n_components)
D = np.empty((n_components, resolution))
for i, center in enumerate(centers):
D[i] = ricker_function(resolution, center, width)

D /= np.sqrt(np.sum(D**2, axis=1))[:, np.newaxis]
return D

resolution = 1024
subsampling = 3 # subsampling factor
width = 100
n_components = resolution // subsampling

# Compute a wavelet dictionary
D_fixed = ricker_matrix(width=width, resolution=resolution, n_components=n_components)
D_multi = np.r_[
tuple(
ricker_matrix(width=w, resolution=resolution, n_components=n_components // 5)
for w in (10, 50, 100, 500, 1000)
)
]

# Generate a signal
y = np.linspace(0, resolution - 1, resolution)
first_quarter = y < resolution / 4
y[first_quarter] = 3.0
y[np.logical_not(first_quarter)] = -1.0

# List the different sparse coding methods in the following format:
# (title, transform_algorithm, transform_alpha, transform_n_nozero_coefs, color)
estimators = [("OMP", "omp", None, 15, "navy"),("Lasso", "lasso_lars", 2, None, "turquoise"),]
lw = 2

plt.figure(figsize=(13, 6))
for subplot, (D, title) in enumerate(zip((D_fixed, D_multi), ("fixed width", "multiple widths"))):
plt.subplot(1, 2, subplot + 1)
plt.title("Sparse coding against %s dictionary" % title)
plt.plot(y, lw=lw, linestyle="--", label="Original signal")
# Do a wavelet approximation
for title, algo, alpha, n_nonzero, color in estimators:
coder = SparseCoder(dictionary=D,transform_n_nonzero_coefs=n_nonzero,transform_alpha=alpha,transform_algorithm=algo,)
x = coder.transform(y.reshape(1, -1))
density = len(np.flatnonzero(x))
x = np.ravel(np.dot(x, D))
squared_error = np.sum((y - x) ** 2)
plt.plot(x,color=color,lw=lw,label="%s: %s nonzero coefs,\n%.2f error" % (title, density, squared_error),)

# Soft thresholding debiasing
coder = SparseCoder(dictionary=D, transform_algorithm="threshold", transform_alpha=20)
x = coder.transform(y.reshape(1, -1))
_, idx = np.where(x != 0)
x[0, idx], _, _, _ = np.linalg.lstsq(D[idx, :].T, y, rcond=None)
x = np.ravel(np.dot(x, D))
squared_error = np.sum((y - x) ** 2)
plt.plot(x,color="darkorange",lw=lw, label="Thresholding w/ debiasing:\n%d nonzero coefs, %.2f error"% (len(idx), squared_error),)
plt.axis("tight")
plt.legend(shadow=False, loc="best")

plt.subplots_adjust(0.04, 0.07, 0.97, 0.90, 0.09, 0.2)
plt.show()

小批量字典学习(Mini-batch Dictionary Learning)是一种改进的字典学习方法,旨在提高大规模数据集上字典学习的效率和可扩展性。与传统的字典学习方法相比,小批量字典学习(Mini-batch Dictionary Learning)通过使用小批量数据来更新字典,从而加速训练过程并减少内存消耗。小批量字典学习(Mini-batch Dictionary Learning)的原理为它将整个数据集划分为多个小批量(mini-batch),并在每个小批量上进行字典更新。这一过程通常包括以下步骤:数据分批,将原始数据集划分为多个小批量,每个小批量包含一定数量的数据样本;稀疏编码,对于每个小批量,使用当前字典对数据进行稀疏编码。这一步通常涉及求解一个优化问题,以找到最优的稀疏表示字典更新,在稀疏编码完成后,使用该小批量的数据和对应的稀疏表示来更新字典。更新过程通常通过最小化重构误差来实现;迭代,重复上述步骤,直到达到预定的迭代次数或满足收敛条件。

小批量字典学习(Mini-batch Dictionary Learning)的优势:计算效率,通过在每次迭代中仅使用小批量数据,可以显著减少计算时间,尤其是在处理大规模数据集时;内存节省,小批量学习减少了对内存的需求,使得可以在资源有限的环境中处理更大的数据集;更好的收敛性,由于引入了随机性,小批量字典学习(Mini-batch Dictionary Learning)避免陷入了局部最优解,从而提高模型的收敛速度和性能。小批量字典学习(Mini-batch Dictionary Learning)是一种高效且灵活的字典学习方法,适用于大规模数据集。通过结合小批量处理技术,它不仅提高了训练速度,还增强了模型的可扩展性鲁棒性