介绍 无监督机器学习 使用的是自学习算法,在学习时无需任何标签,也无需事先训练。相反,模型会获得不带标签的原始数据。自学习规则,并根据相似之处、差异和模式来建立信息结构,且无需向该模型提供关于如何处理各项数据的明确说明。无监督机器学习 更适合处理复杂的任务。它能够很好的识别出数据中以前未检测到的模式,并且有助于识别用于数据分类的特征。假设有一个关于天气的大型数据集,无监督学习算法会分析数据并识别数据点中的模式。例如,它可能会按温度或类似的天气模式对数据进行分组。虽然算法本身无法根据之前提供的任何信息来理解这些模式,但可以查看数据分组情况,并根据对数据集的理解并对其进行分类。例如天气模式被划分为不同类型的天气,如雨、雨夹雪或雪。
一般来说,有三种类型的无监督学习 任务:聚类 、关联规则 和降维 。
聚类 聚类 是一种探索未加标签的原始数据,并根据相似情况或差异将这些数据细分为多个组(或集群)的技术。该技术可用于各种应用,包括客户细分 、欺诈检测 和图像分析 。聚类算法通过发现未分类数据中的相似结构或模式,将数据拆分为多个自然分组。聚类 是最常用的无监督机器学习 方法之一。用于聚类 的无监督式学习 算法有多种,其中包括独占、重叠、分层和概率学习算法。
独占聚类 :使用此算法分组数据时,单个数据点仅能存在于一个分组(集群)中。这也称为“硬”聚类 。独占聚类 的一个常见示例是K-means聚类算法 ,该算法将数据点划分为用户定义的K个聚类 。重叠聚类 :使用此算法分组数据时,单个数据点可存在于两个或多个关联紧密度不同的分组(集群)中。这也称为“软”聚类 。层次聚类 :数据根据相似性分成不同的聚类 ,然后根据它们的层次关系反复合并和组织。层次聚类 主要有两种类型:凝聚式聚类 和分裂式层次聚类 。这种方法也称为HAC(层次集群分析 )。概率聚类 :根据每个数据点属于各个集群的概率,将数据分组到各分组(集群)中。这种方法与其他方法不同(根据数据点与集群中其他数据点的相似性对其进行分组)。
关联(Association) 关联 是一种基于规则 的方法,揭示大型数据集中数据点之间的关系。无监督学习算法 会搜索频繁的“if-then”关联 (也称为规则),以发现数据中的相关性和同现情况,以及数据对象之间的不同联系。它最常用于分析零售购物车或交易数据集,以展示某些商品一起购买的频率。这些算法可以揭示客户购买模式以及之前未发现的产品关系,为商品推荐引擎 或其他交叉销售机会提供信息。这些规则 最常用的形式是线上零售商店中“经常一起购买”和“购买过该商品的人还买过”部分。关联 通常也用于整理临床诊断的医疗数据集。使用无监督式机器学习 和关联 ,可以帮助医生通过比较过往病例的症状之间的关系,确定特定诊断的可能性。一般来说,Apriori算法最常用于关联学习 ,以标识相关的内容集合。不过也会使用其他类型,例如Eclat算法和FP-Growth算法。
降维 降维 是一种无监督机器学习 技术,用于减少数据集中的特征或维度数量。对机器学习而言,通常是数据越多越好,但是大量的数据也会增加直观呈现数据洞见的难度。降维 可以从数据集中提取重要特征,从而减少其中不相关或随机特征的数量。这种方法使用主成分分析 (PCA) 和奇异值分解 (SVD)算法来减少数据输入的数量,同时不会破坏原始数据中属性的完整性。
无监督学习示例
异常值检测 :无监督式聚类 可以处理大型数据集,并发现数据集中非典型的数据点。商品推荐引擎 :无监督机器学习 可以利用关联 (规则)来探索交易数据,从而发现模式或趋势,从而为线上零售商提供个性化推荐 。客户细分 :无监督机器学习 也常用于通过对客户的共同特征或购买行为进行聚类 来生成买家画像。然后,参考这些资料来制定营销和其他业务策略。欺诈检测 :无监督机器学习 对于异常值检测 很有用,可以发现数据集中的异常数据点。这些数据分析有助于发现数据中偏离正常模式的事件或行为,从而揭露欺诈性交易 或机器人活动 等异常行为。自然语言处理 (NLP):无监督机器学习 通常用于各种NLP应用,例如对新闻版面中的文章分类、文本翻译和分类,或对话界面中的语音识别。基因研究 :基因聚类 是另一个常见的无监督机器学习 例子。层次聚类算法 通常用于分析DNA模式和揭示进化关系。
聚类 1932年,HE Driver和ALKroeber在论文Quantitative expression of cultural relationship聚类 方法。自那时起,这项技术取得了长足进步,并被用于探索许多应用领域的未知领域。聚类 是一种无监督机器学习 ,需要从未标记的数据集中提取参考(特征、模式)。通常,它用于捕获数据集中固有的有意义的结构、底层过程和分组。在聚类任务 是将总体分成几组,使得同一组中的数据点比其他组中的数据点更相似。简而言之,它是基于相似性和不相似性的对象集合 。通过聚类 ,数据科学家可以发现未标记数据中的内在分组。虽然没有特定的标准来衡量聚类 ,但这完全取决于用户,并如何使用它来满足特定的需求。它可用于查找数据中的异常数据点/异常值,或识别未知属性以在数据集中找到合适的分组 。举个例子,假设您在沃尔玛商店担任经理,并希望更好地了解您的客户,以便使用新的和改进的营销策略 来扩大业务。手动细分客户很困难。您有一些包含他们的年龄和购买历史的数据,在这里聚类 可以根据客户的支出对数据进行分组 。一旦完成客户细分,您就可以根据目标受众为每个组定义不同的营销策略 。
K-means聚类 K-means聚类 是一种矢量量化方法 ,最初来自信号处理 ,旨在将n个观测值划分为k个聚类 ,其中每个观测值属于最接近均值 的聚类 ,作为该聚类 的原型。K-means是一种基于质心 的聚类算法 ,计算每个数据点与质心 之间的距离,将其分配到一个聚类 中。目标是识别数据集中的K个组。这是一个将每个数据点分配到组中的迭代过程,数据点会根据相似特征聚类 。目标是最小化数据点与聚类 中心之间的距离总和,以确定每个数据点应该属于的正确组。在这里,将数据空间划分为K个簇 ,并为每个簇 分配一个平均值。数据点被放置在最接近该簇 平均值的簇 中。有几种距离度量可用于计算距离。
K-means的工作原理 :第一步,选择聚类的数量 ,就是定义簇数K,k个聚类的质心;第二步,初始化聚类质心 ,所谓质心 就是聚类的中心,一般最初的时候聚类的中心都是未知的。所以我们选择随机的数据点作为每个聚类的质心 ;第三步,将数据点分配给最近的簇 ,质心已经初始化,接下来是将数据点更新聚类质心 ,在所有数据点被分配到相应的簇后,更新每个簇的质心为该簇内所有数据点的均值:迭代过程 ,重复步骤3和4,直到质心不再发生显著变化,或达到设定的迭代次数,算法收敛时,聚类结果稳定;第六步,目标函数 ,K-means的目标是最小化每个簇内的数据点与其质心之间的平方误差 ,K-means算法旨在使目标函数
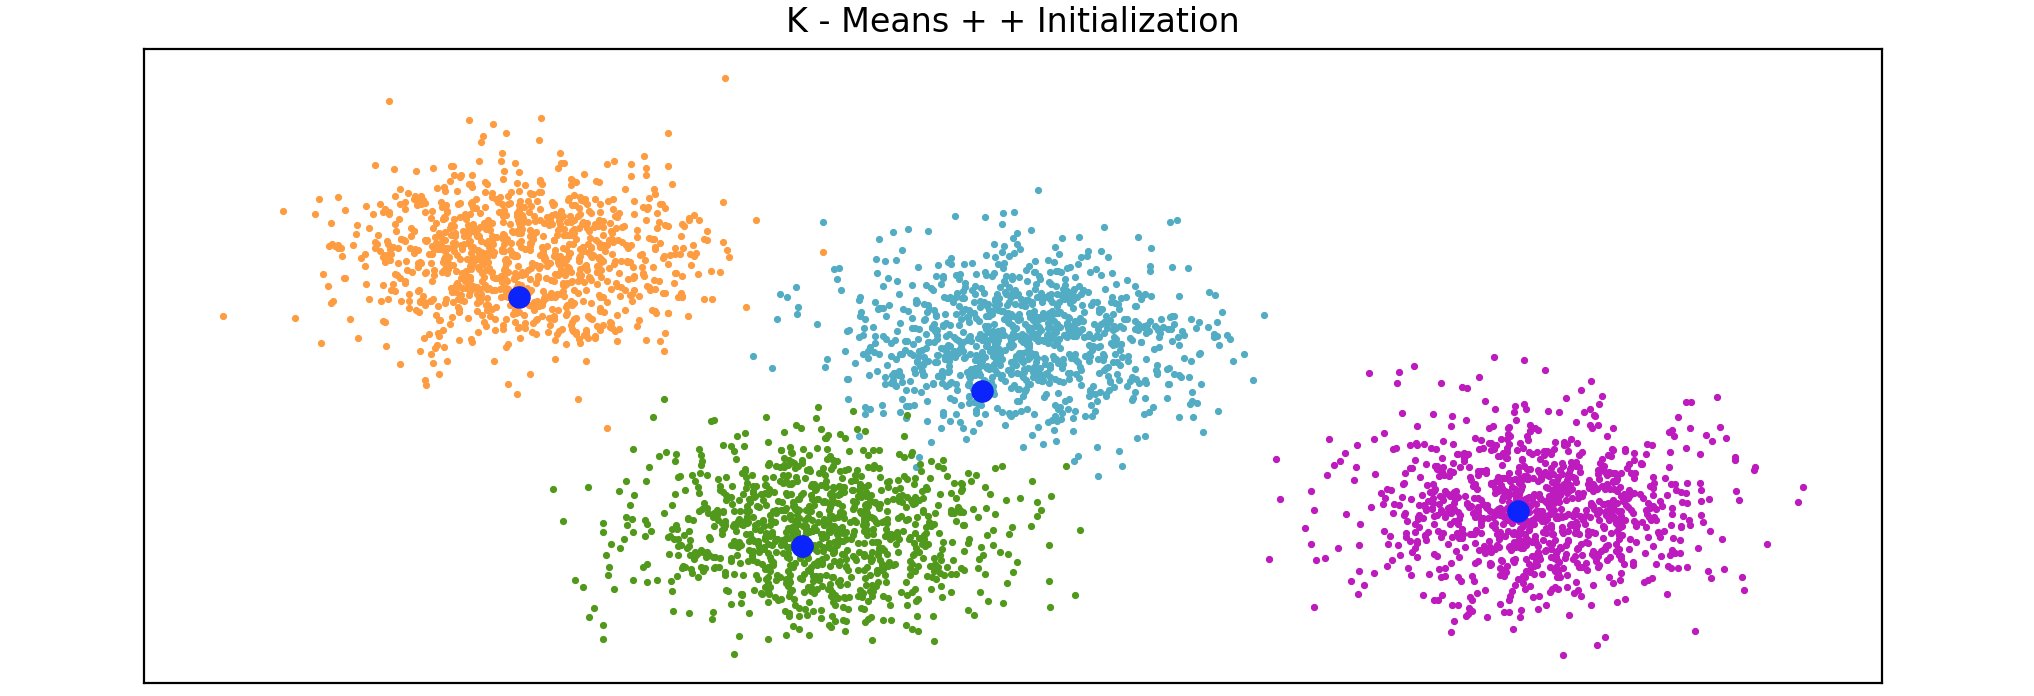
质心初始化方法 的目标是聚类的质心初始化后尽可能接近实际质心的最佳值 。常用的方法有,随机数据点定义聚类的质心 ,这是初始化质心的传统方法,其中选择简单分片 ,分片质心初始化算法,主要依赖于数据集中特定实例或行的所有属性的综合值,其思想是计算综合值,然后对数据实例进行排序,然后将其水平划分为K-means++,K-means++是K-means算法的智能质心初始化方法,目标是通过随机分配第一个质心,然后根据最大平方距离选择其余质心来分散初始质心,其想法将质心初始化为彼此远离,从而产生比随机初始化更好的结果。K-means++用作K-means的默认初始化,scikit-learn的K-means++初始化代码实现:
1
2
3
4
5
6
7
8
9
10
11
12
13
14
15
16
17
18
19
20
21
22
23
24
25
26
import matplotlib.pyplot as pltfrom sklearn.cluster import kmeans_plusplusfrom sklearn.datasets import make_blobsn_samples = 4000 n_components = 4 X, y_true = make_blobs(n_samples=n_samples, centers=n_components, cluster_std=0.6 , random_state=0 ) X = X[:, ::-1 ] centers_init, indices = kmeans_plusplus(X, n_clusters=4 , random_state=0 ) plt.figure(1 ) colors = ["#4EACC5" , "#FF9C34" , "#4E9A06" , "m" ] for k, col in enumerate (colors): cluster_data = y_true == k plt.scatter(X[cluster_data, 0 ], X[cluster_data, 1 ], c=col, marker="." , s=10 ) plt.scatter(centers_init[:, 0 ], centers_init[:, 1 ], c='b' , s=50 ) plt.title("K - Means + + Initialization" ) plt.xticks([]) plt.yticks([]) plt.show()
K-means是如何处理真实数据的。这里有一个购物中心访客数据集(2000名)来创建客户细分,从而制定营销策略。先加载数据并检查是否有任何的缺失值:
1
2
3
4
5
6
7
8
9
10
11
12
import pandas as pdimport numpy as npimport matplotlib.pyplot as pltcustomer_data = pd.read_csv("Mall_Customers.csv" ) print (customer_data.head())print (customer_data.isna().sum ())
结果输出为:
1
2
3
4
5
6
7
8
9
10
11
12
13
CustomerID Genre Age Annual_Income_(k$) Spending_Score 0 1 Male 19 15 39 1 2 Male 21 15 81 2 3 Female 20 16 6 3 4 Female 23 16 77 4 5 Female 31 17 40 CustomerID 0 Genre 0 Age 0 Annual_Income_(k$) 0 Spending_Score 0
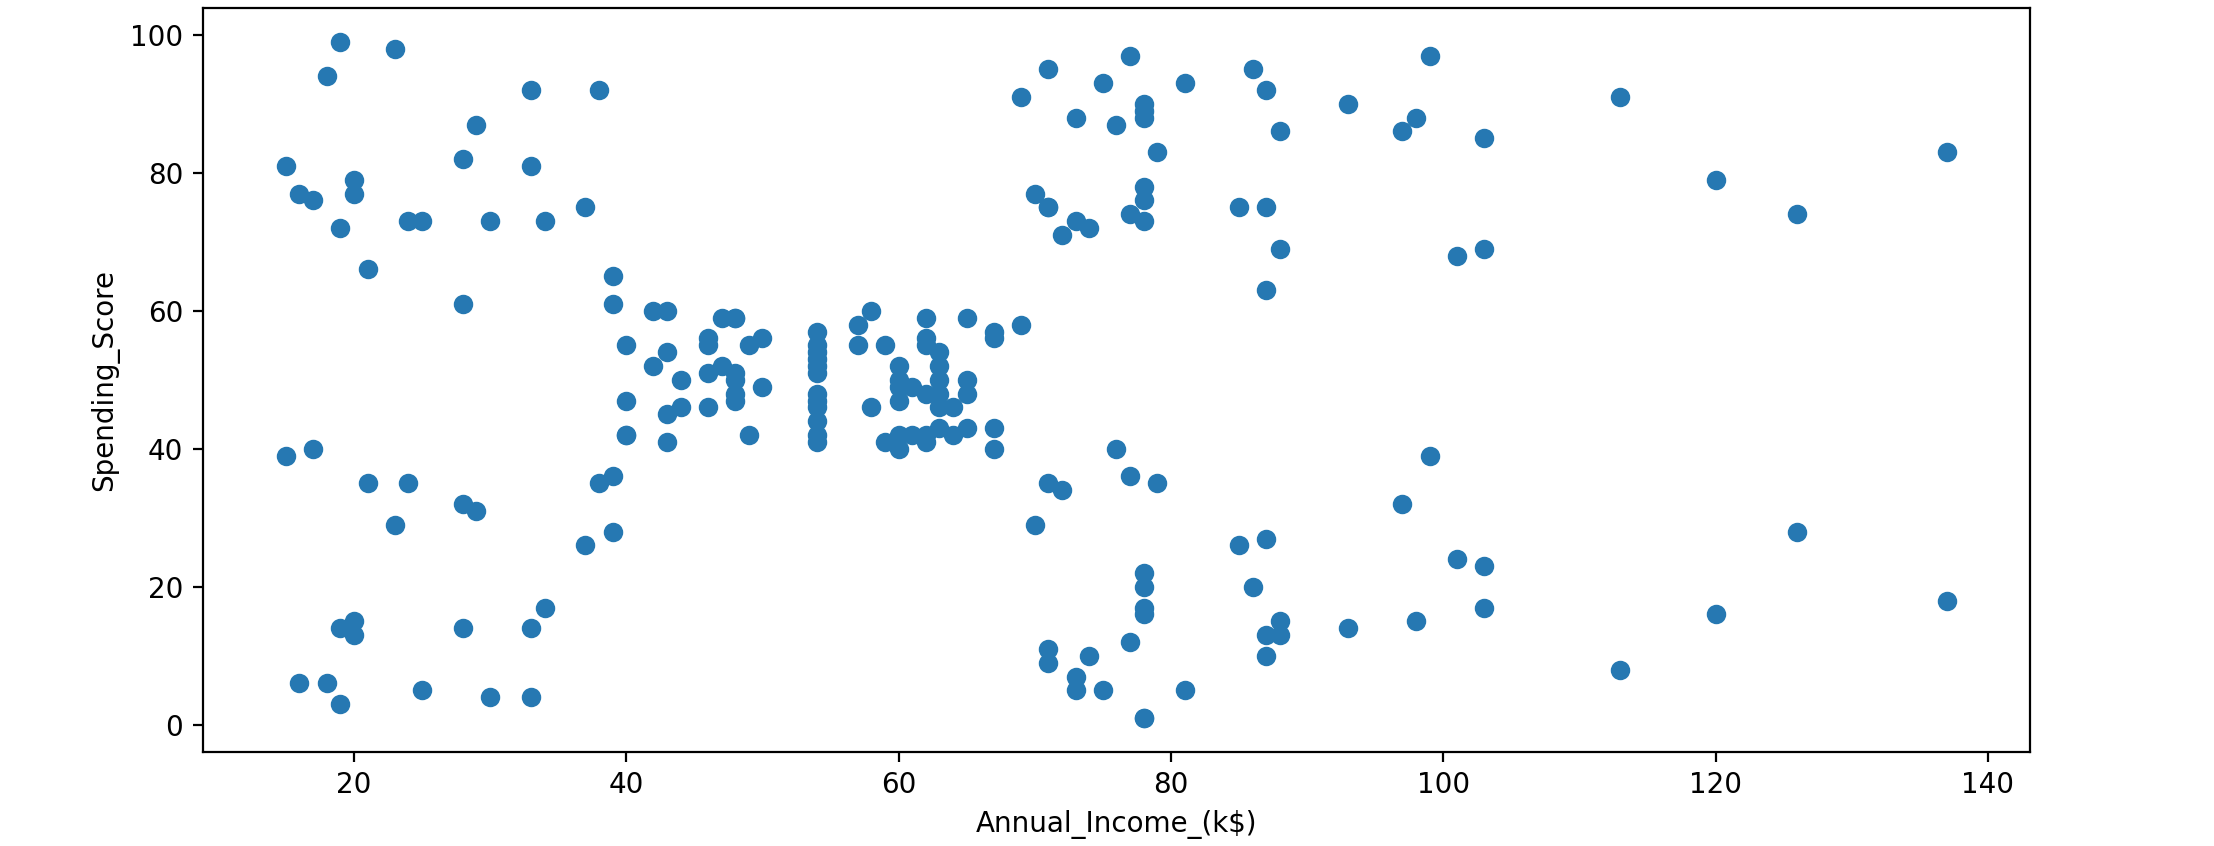
使用年度收入和支出分数来查找数据中的聚类。支出分数从1~100,根据客户行为和支出性质分配。先看一下数据并了解他是如何分布的。
1 2 3 4 plt.scatter(customer_data['Annual_Income_(k$)' ], customer_data['Spending_Score' ]) plt.xlabel('Annual_Income_(k$)' ) plt.ylabel('Spending_Score' ) plt.show()
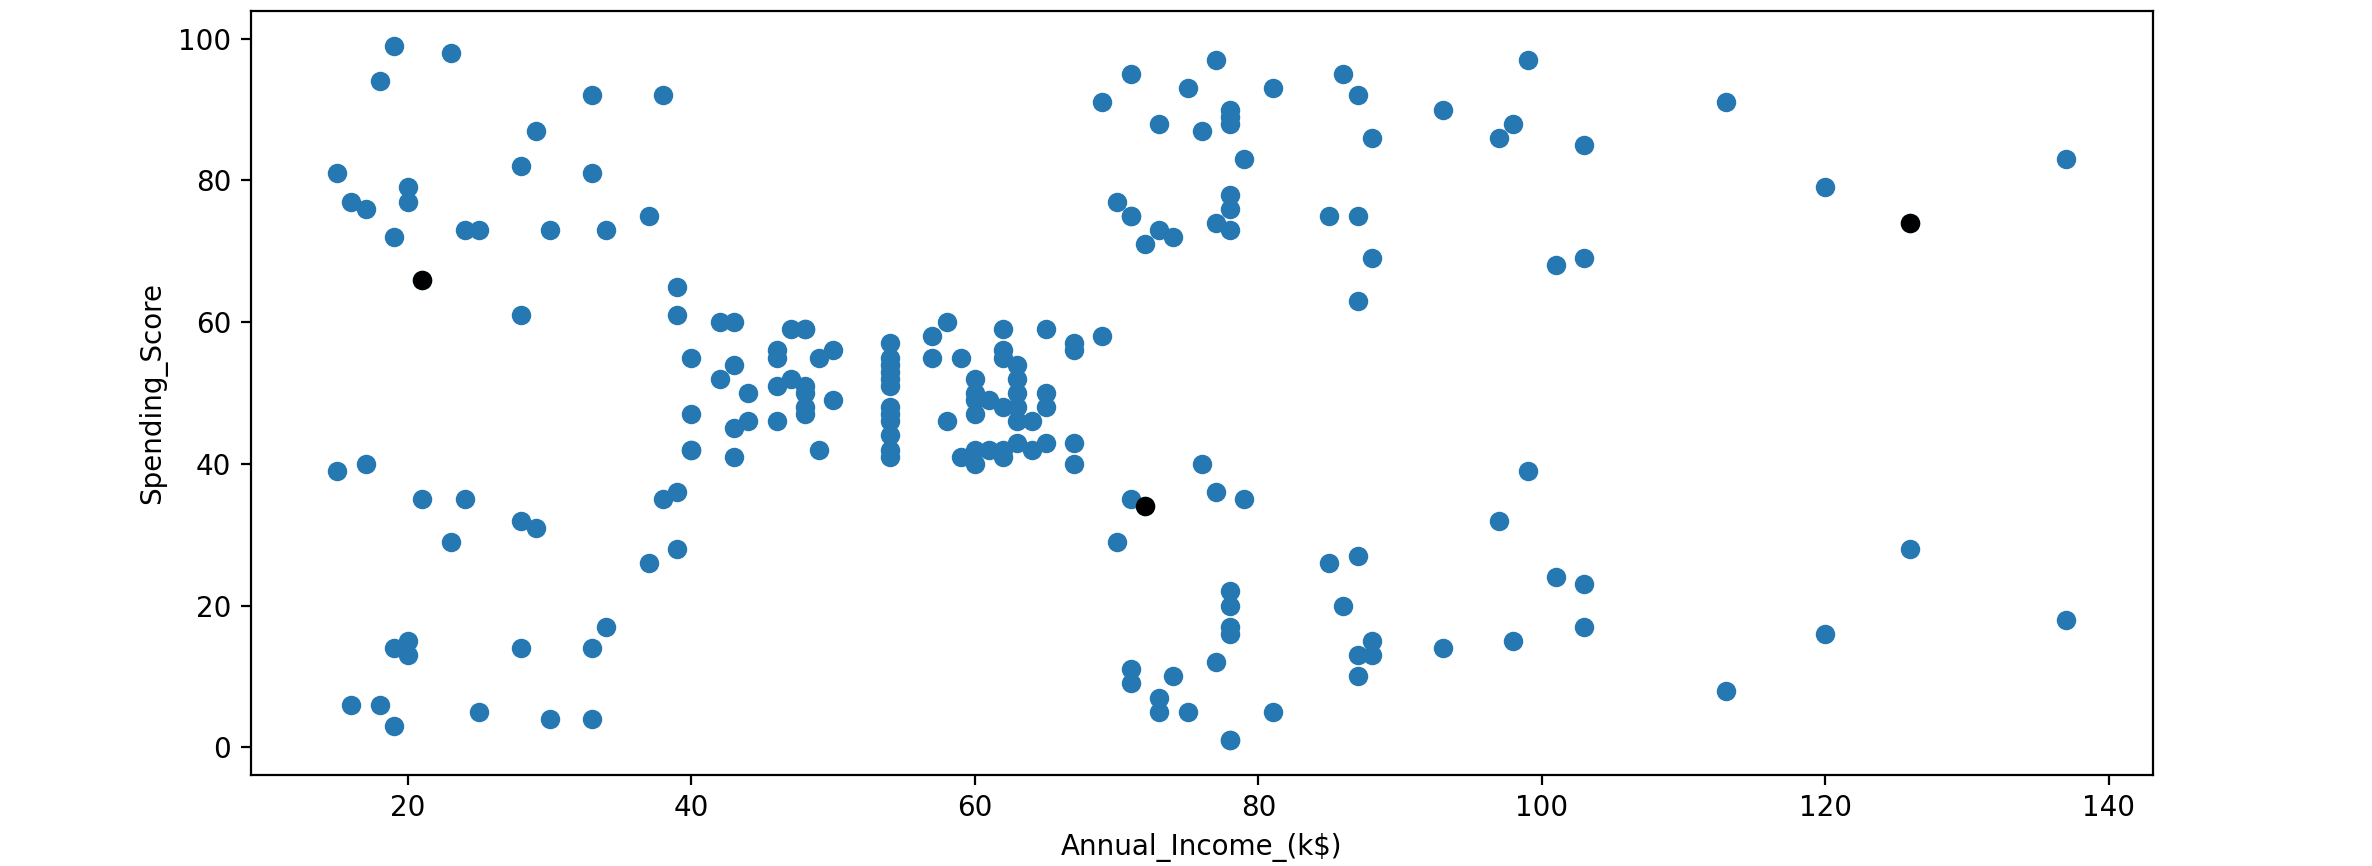
从上面的散点图来看,很难判断数据集中是否存在任何模式。这时,聚类 就会有所帮助。首先随机初始化聚类质心 。
1
2
3
4
5
6
centroids = customer_data.sample(n=3 ) plt.scatter(customer_data['Annual_Income_(k$)' ], customer_data['Spending_Score' ]) plt.scatter(centroids['Annual_Income_(k$)' ], centroids['Spending_Score' ], c='black' ) plt.xlabel('Annual_Income_(k$)' ) plt.ylabel('Spending_Score' ) plt.show()
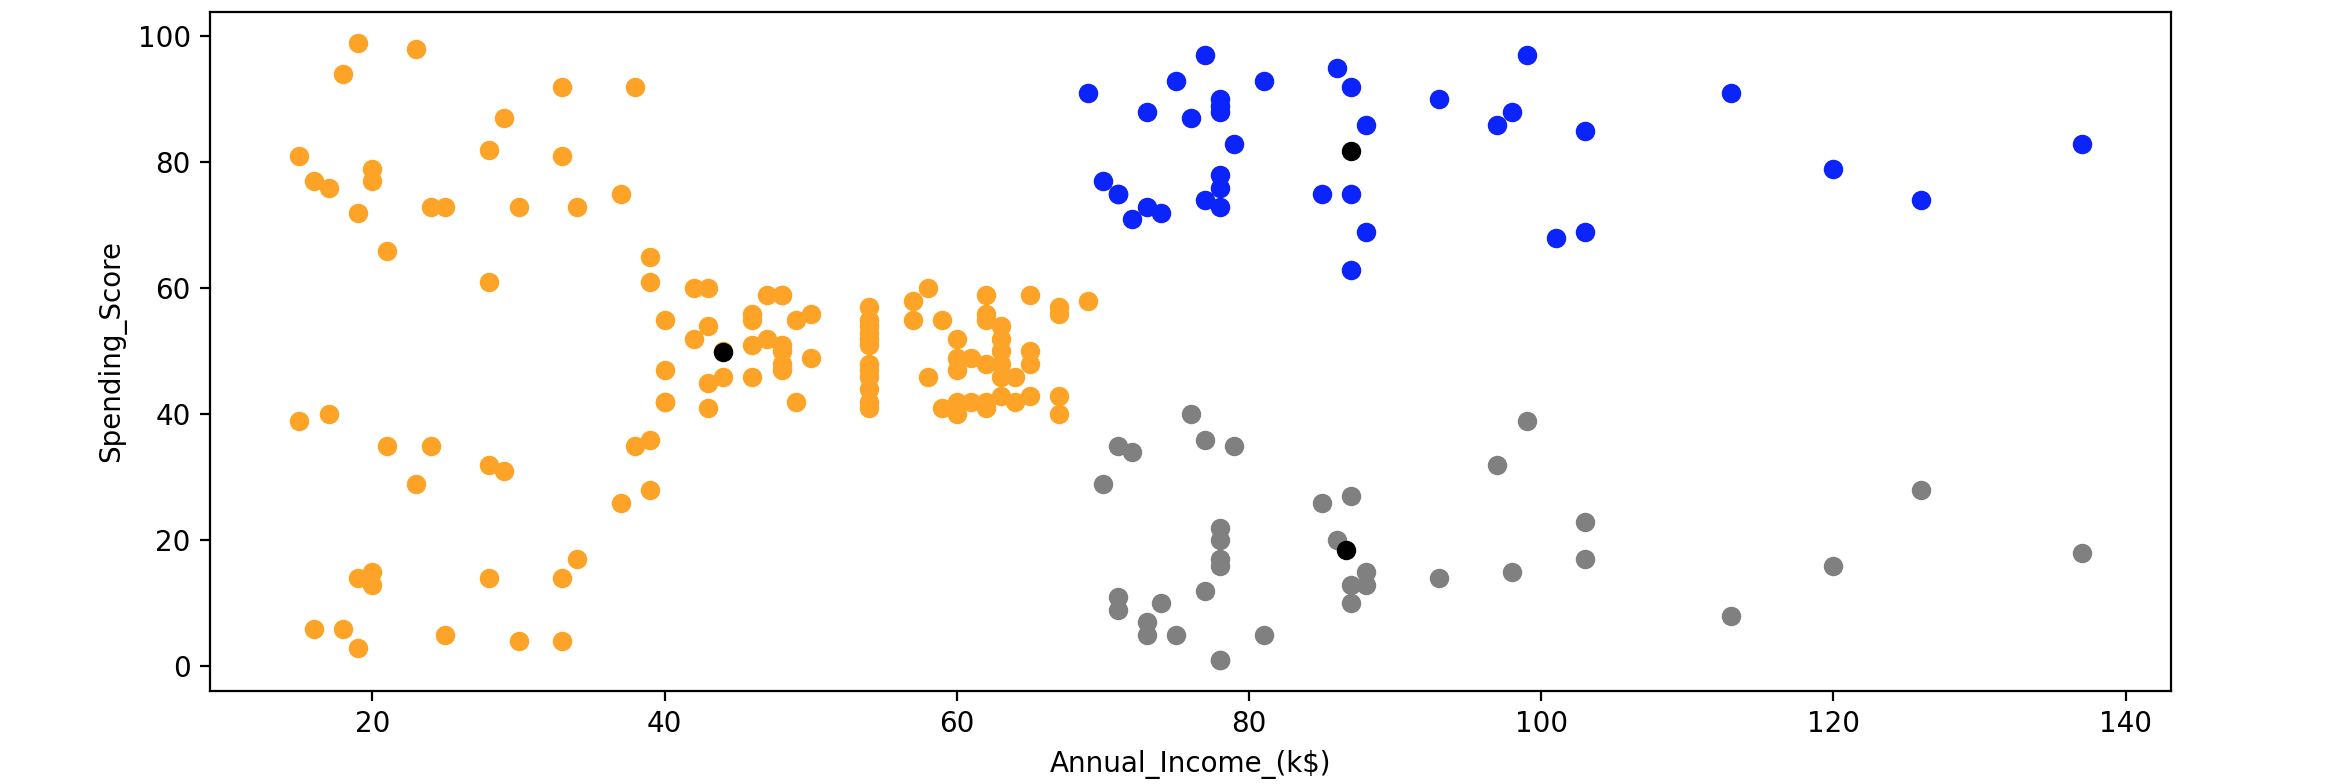
接下来遍历每个质心和数据点,计算它们之间的距离,找到聚类 并将数据点分配给一个最近的聚类 。这个过程将持续到先前定义的质心和当前质心之间的差异接近为0:
1
2
3
4
5
6
7
8
9
10
11
12
13
14
15
16
17
18
19
20
21
22
23
24
25
26
27
28
29
30
31
32
33
34
35
36
37
38
39
40
41
42
43
44
45
K = 3 centroids = customer_data.sample(n=K) mask = customer_data['CustomerID' ].isin(centroids.CustomerID.tolist()) X = customer_data[~mask] diff = 1 j = 0 XD = X while (diff != 0 ): i = 1 for index1, row_c in centroids.iterrows(): ED = [] for index2, row_d in XD.iterrows(): d1 = (row_c["Annual_Income_(k$)" ] - row_d["Annual_Income_(k$)" ])**2 d2 = (row_c["Spending_Score" ] - row_d["Spending_Score" ])**2 d = np.sqrt(d1 + d2) ED.append(d) X[i] = ED i = i + 1 C = [] for index, row in X.iterrows(): min_dist = row[1 ] pos = 1 for i in range (K): if row[i + 1 ] < min_dist: min_dist = row[i + 1 ] pos = i + 1 C.append(pos) X["Cluster" ] = C centroids_new = X.groupby(["Cluster" ]).mean()[["Spending_Score" , "Annual_Income_(k$)" ]] if j == 0 : diff = 1 j = j + 1 else : diff = (centroids_new['Spending_Score' ] - centroids['Spending_Score' ]).sum () + (centroids_new['Annual_Income_(k$)' ] - centroids['Annual_Income_(k$)' ]).sum () centroids = X.groupby(["Cluster" ]).mean()[["Spending_Score" , "Annual_Income_(k$)" ]] color = ['grey' , 'blue' , 'orange' ] for k in range (K): data = X[X["Cluster" ] == k + 1 ] plt.scatter(data["Annual_Income_(k$)" ], data["Spending_Score" ], c=color[k]) plt.scatter(centroids["Annual_Income_(k$)" ], centroids["Spending_Score" ], c='black' ) plt.xlabel('Annual_Income_(k$)' ) plt.ylabel('Spending_Score' ) plt.show()
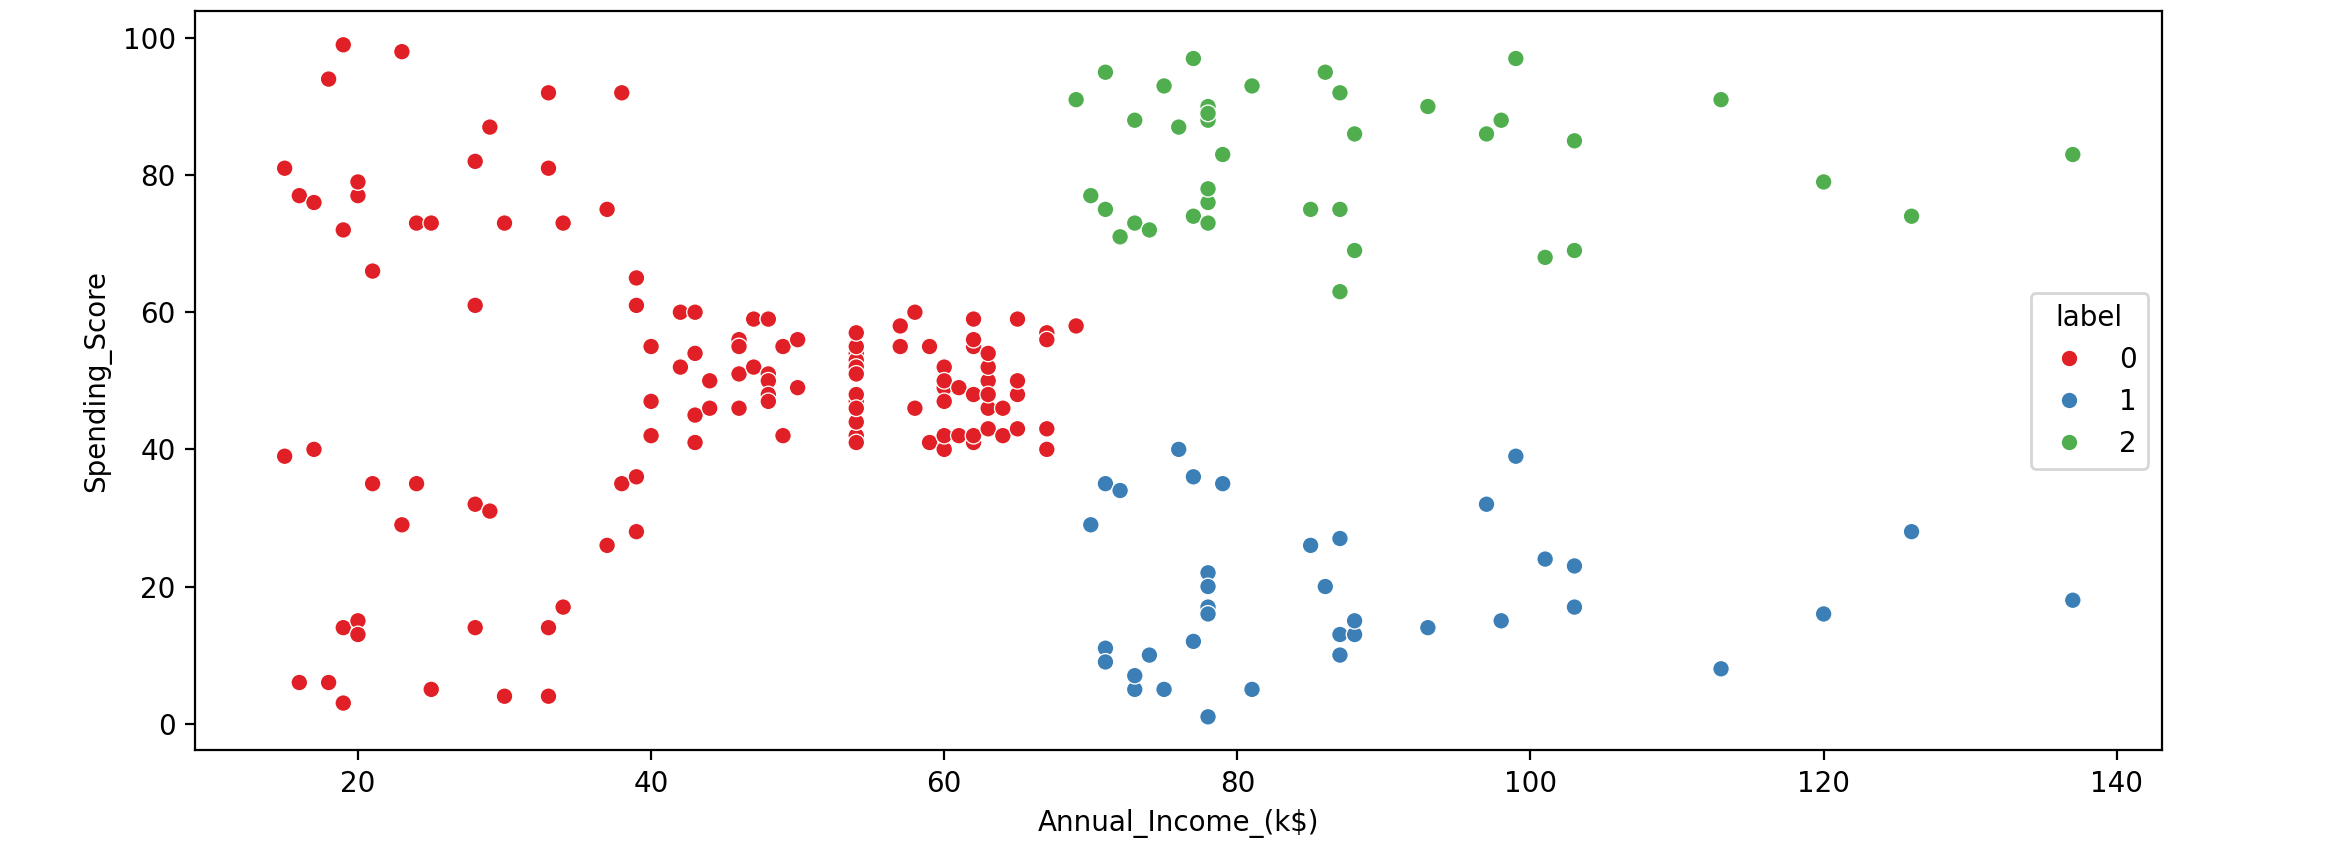
Scikit-Learn实现K-means,首先,导入K-Means函数,然后通过传递聚类 数量作为参数来调用该函数:
1
2
3
4
5
6
7
8
9
import seaborn as snsfrom sklearn.cluster import KMeanskm_sample = KMeans(n_clusters=3 ) km_sample.fit(customer_data[['Annual_Income_(k$)' ,'Spending_Score' ]]) labels_sample = km_sample.labels_ customer_data['label' ] = labels_sample sns.scatterplot(customer_data['Annual_Income_(k$)' ],customer_data['Spending_Score' ],hue=customer_data['label' ],palette='Set1' )
我们使用Scikit-Learn几行代码创建客户数据的细分。最终的聚类数据在两种实现中是相同的。标签0:储蓄者,平均收入至高收入但明智消费;标签1:无忧无虑,收入低,但花钱大手大脚;标签2:消费者,平均收入至高收入。商场管理层可以相应地调整营销策略,例如,向标签0:储蓄者群体提供更多储蓄优惠,为标签2:大手笔消费者开设更多利润丰厚的商店。
K如何选择?一些因素会影响K-means聚类 算法输出的有效性,其中之一就是确定聚类数(欠拟合 ,而指定较多的聚类数会导致过拟合 。最佳聚类 数取决于相似性度量 和用于聚类的参数 。因此,要找到数据中的聚类数,我们需要对执行K-means聚类 一系列值进行比较。目前,可以使用一些技术来估计该值,包括交叉验证 、肘部法 (Elbow Method)、信息准则 、轮廓法 (Silhouette)和G-means算法。
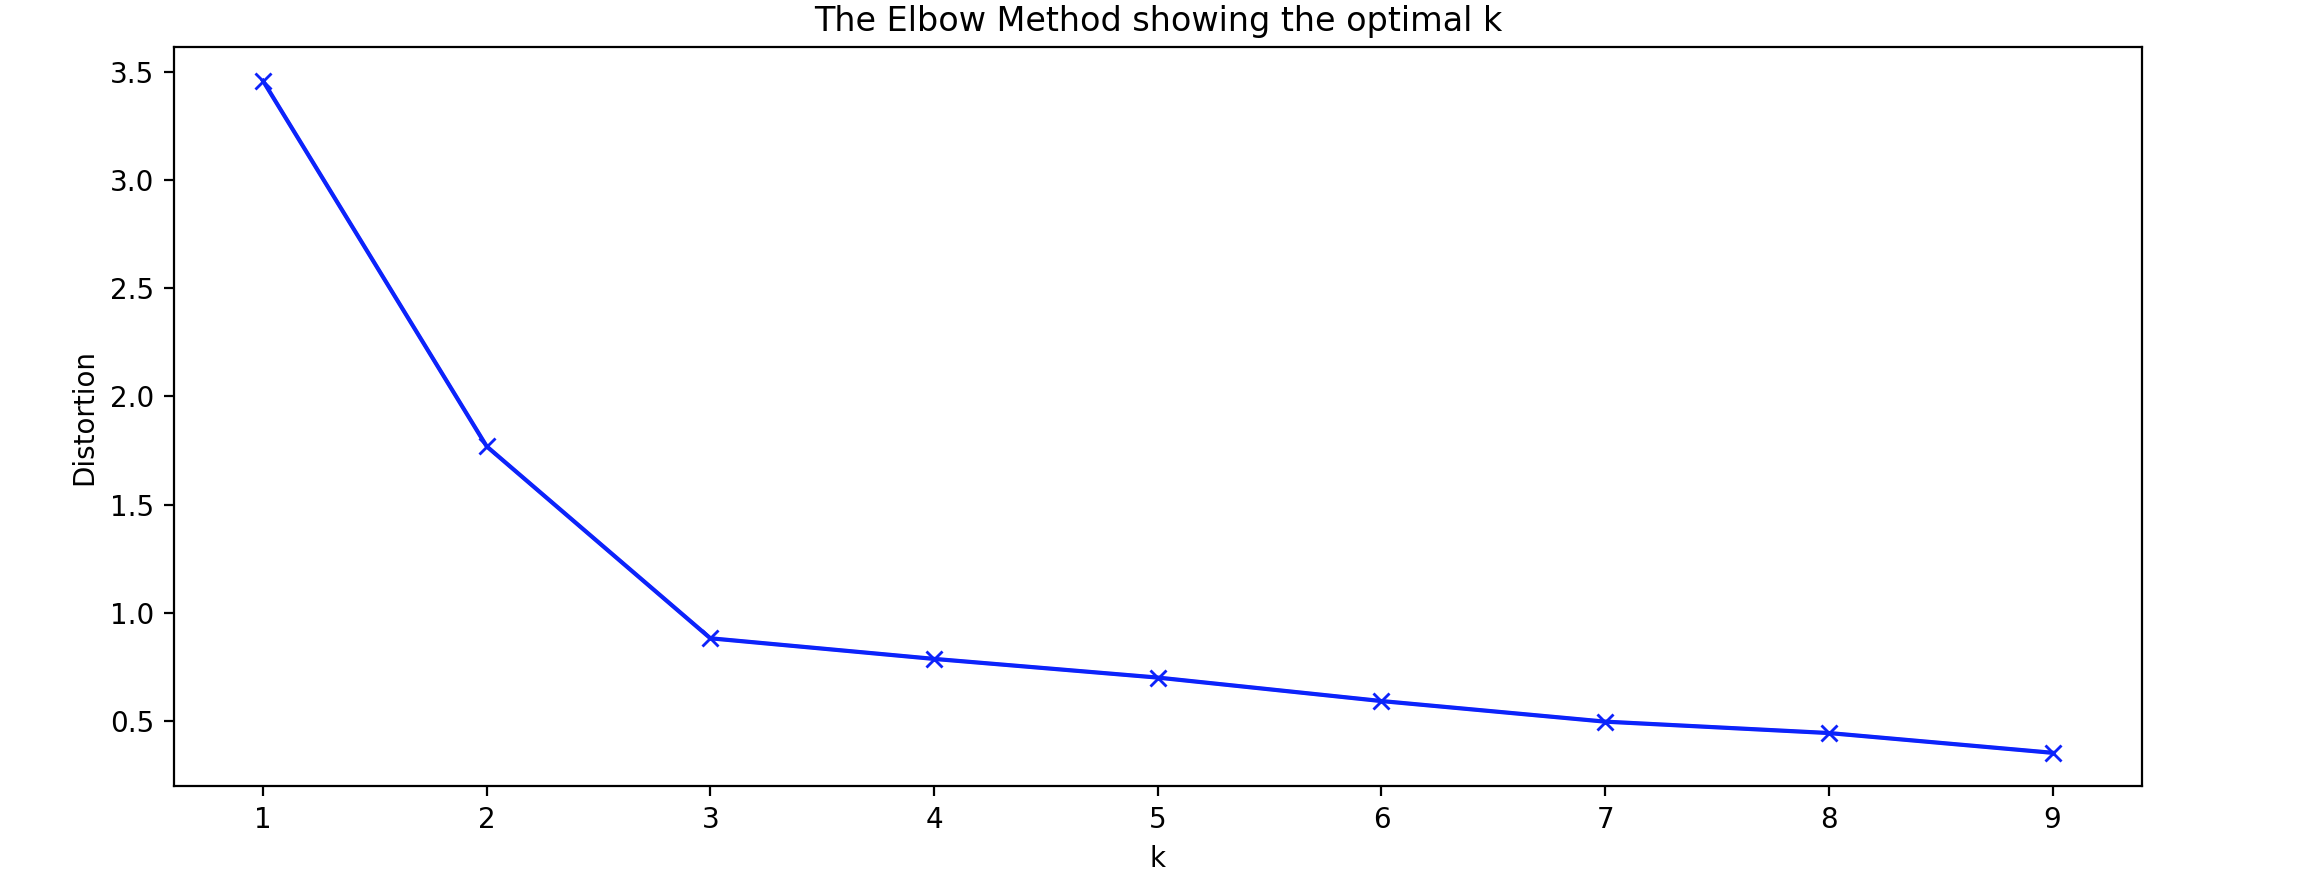
肘部法 (Elbow Method):距离度量是比较不同肘部法 (Elbow Method)中,绘制平均距离并寻找减少率发生变化的肘点 。这个肘点可用于确定聚类 中,当添加另一个聚类不会改善建模结果时,它用于选择一定数量的聚类。这是一个迭代过程,其中将对数据集进行K-means聚类 ,K-means聚类 。对于每个1 2 3 4 5 6 7 8 9 10 11 12 13 14 15 16 17 18 19 20 21 22 23 24 25 from sklearn.cluster import KMeansfrom sklearn import metricsfrom scipy.spatial.distance import cdistimport numpy as npimport matplotlib.pyplot as pltx1 = np.array([3 , 1 , 1 , 2 , 1 , 6 , 6 , 6 , 5 , 6 , 7 , 8 , 9 , 8 , 9 , 9 , 8 ]) x2 = np.array([5 , 4 , 5 , 6 , 5 , 8 , 6 , 7 , 6 , 7 , 1 , 2 , 1 , 2 , 3 , 2 , 3 ]) X = np.array(list (zip (x1, x2))).reshape(len (x1), 2 ) distortions = [] K = range (1 ,10 ) for k in K: kmeanModel = KMeans(n_clusters=k).fit(X) kmeanModel.fit(X) distortions.append(sum (np.min (cdist(X, kmeanModel.cluster_centers_, 'euclidean' ), axis=1 )) / X.shape[0 ]) plt.plot(K, distortions, 'bx-' ) plt.xlabel('k' ) plt.ylabel('Distortion' ) plt.title('The Elbow Method showing the optimal k' ) plt.show()
这可能是确定最佳簇数的最常用方法。不过,找到拐点可能是一个挑战,因为在实践中可能没有尖锐的拐点。
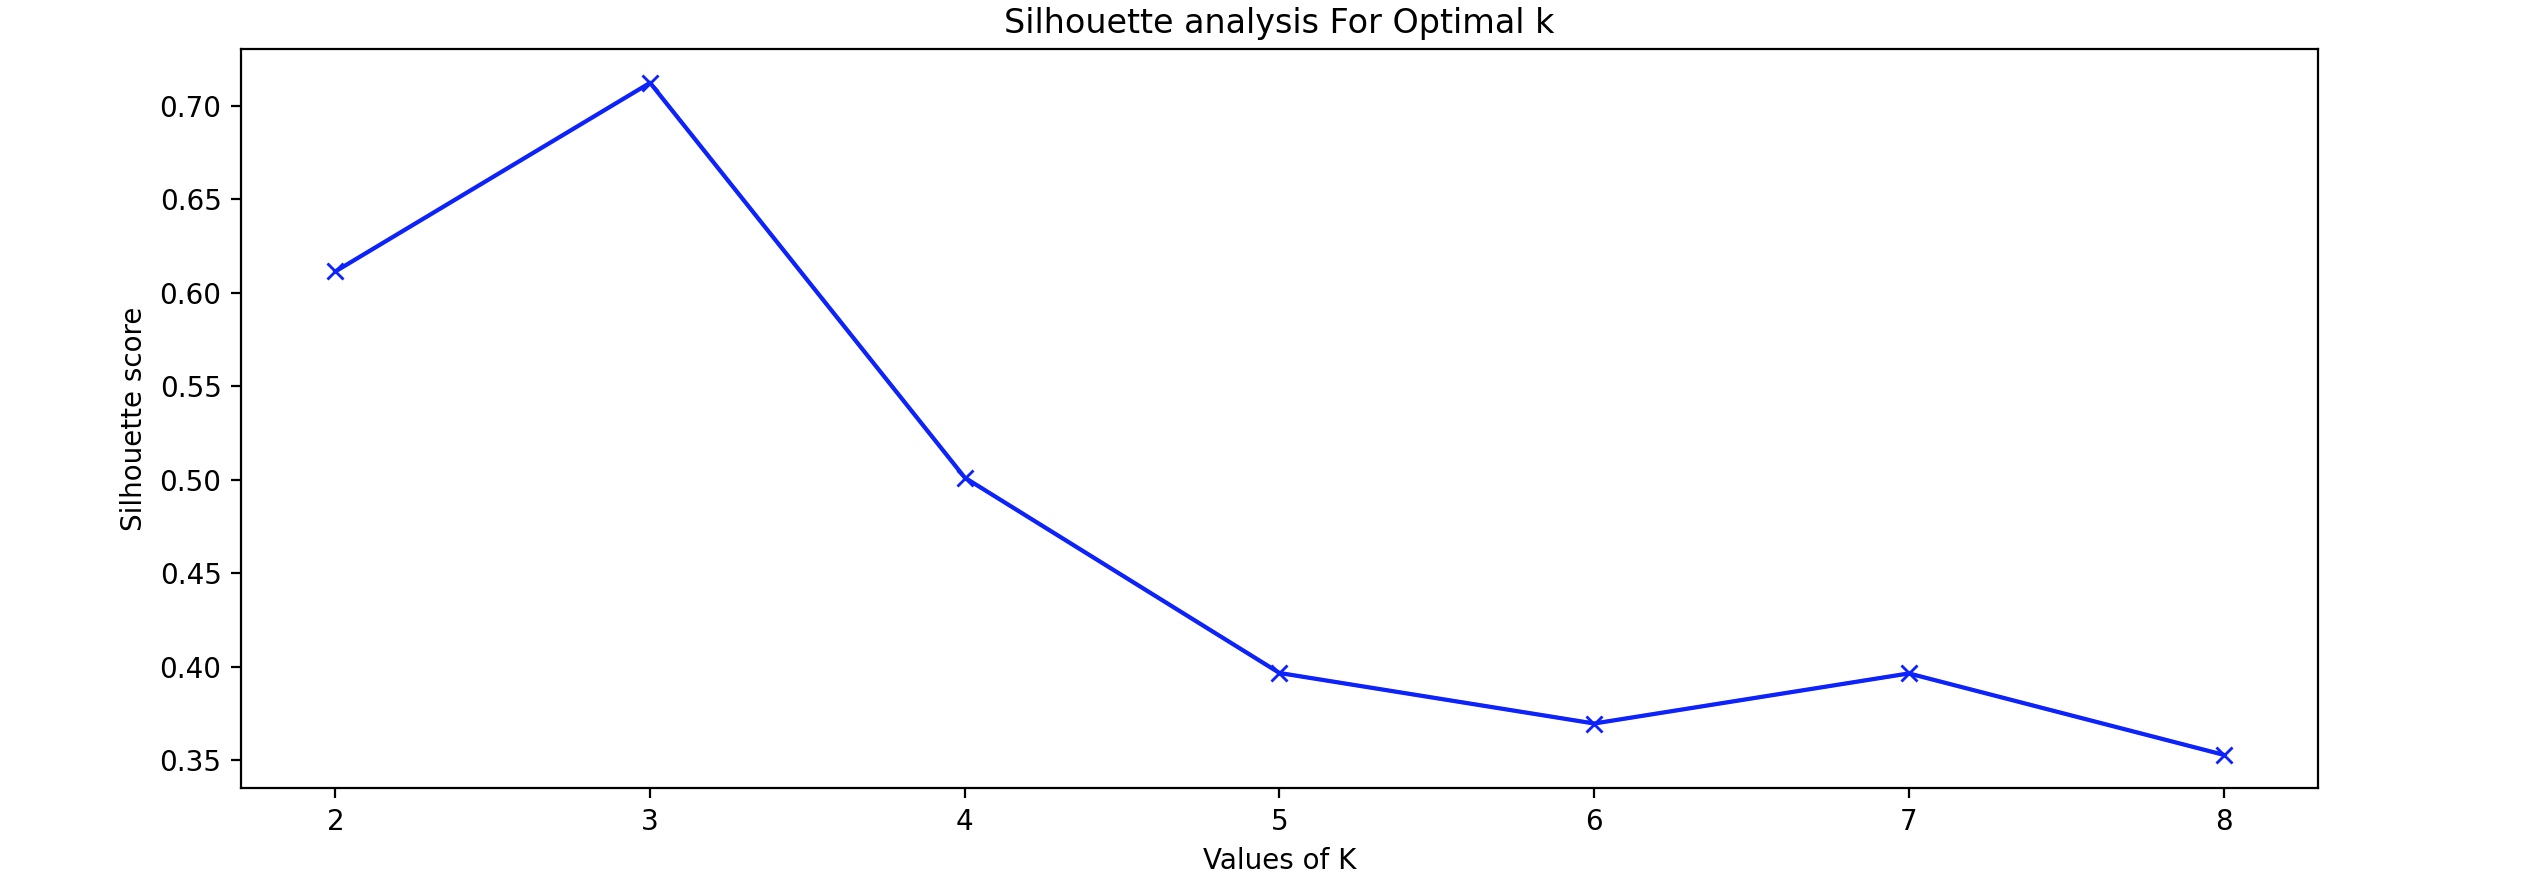
轮廓法 (Silhouette):轮廓法 是指一种解释和验证数据集群内一致性的方法。该技术以简洁的图形表示每个对象的分类情况。轮廓系数 用于通过检查某个簇内的数据点与其他簇的相似程度来衡量簇的质量。轮廓分析 可用于研究簇之间的距离。此离散测量值介于-1和1之间:+1:表示数据点距离相邻簇较远,因此位置最佳。0:表示它位于两个相邻集群之间的决策边界上。-1:表示数据点被分配到错误的簇。为了找到聚类数K-means聚类 算法,对于1 2 3 4 5 6 7 8 9 10 11 12 13 14 15 16 from sklearn.metrics import silhouette_scoresil_avg = [] range_n_clusters = [2 , 3 , 4 , 5 , 6 , 7 , 8 ] for k in range_n_clusters: kmeans = KMeans(n_clusters = k).fit(X) labels = kmeans.labels_ sil_avg.append(silhouette_score(X, labels, metric = 'euclidean' )) plt.plot(range_n_clusters,sil_avg,'bx-' ) plt.xlabel('Values of K' ) plt.ylabel('Silhouette score' ) plt.title('Silhouette analysis For Optimal k' ) plt.show()
利用轮廓法 (Silhouette)分析,选择Silhouette)分数最高,表明数据点的位置处于最佳状态。
聚类评估指标 :在聚类中,没有任何标记的数据,只有一组特征,目标是获得这些特征的高簇内相似性和低簇间相似性。评估任何聚类 算法的性能并不像在监督学习中计算错误数量、找到精度 或召回率 那么容易,目前有多种可用的聚类评估指标。
兰德指数 (Rand Index):是一种用于评估聚类结果与真实标签之间相似度的指标。它通过比较数据点在不同聚类中的分组情况,量化聚类的质量。兰德指数 (Rand Index)的值介于0和1之间,值越高表示聚类结果与真实标签越一致。如果
a代表b代表
兰德指数 (Rand Index)公式如下:兰德指数 (Rand Index)并不能保证随机标签分配会得到接近于零的值(特别是当聚类的数量与样本的数量在同一数量级时)。为了抵消这种影响,我们可以降低
轮廓系数 (Silhouette Coefficient):轮廓系数 (Silhouette Coefficient)针对每个样本定义,轮廓系数 (Silhouette Coefficient)介于-1(表示聚类不正确)和+1(表示聚类高度密集)之间。分数接近零表示聚类重叠。由两个分数组成:
a:样本与同一类别中所有其他点之间的平均距离。b:一个样本与下一个最近簇中所有其他点之间的平均距离。轮廓系数 (Silhouette Coefficient)
K-means聚类 的优点:
相对容易理解和实施。
可扩展至大型数据集。
更好的计算成本。
轻松热启动质心的分配和位置。
K-means聚类 算法的缺点:
手动选择
对于不同的
总是试图找到圆形簇。
由于数据集中的异常值,质心被拖拽。
维数灾难,当维数增加时,
异常值(Outliers)和新颖点(Novelty) 异常值 (Outliers)和新颖点 (Novelty)是数据分析中的两个重要概念,旨在识别与大多数数据点显著不同的实例。这些实例可能是异常值 (Outliers)或新颖点 (Novelty),在许多应用中具有重要意义,如欺诈检测、故障检测和生物监测等。
异常值 (Outliers):指在数据集中明显偏离其他数据点的实例。这些数据点通常是由于测量错误、数据录入错误或极端情况造成的。异常值 (Outliers)可能会对分析结果产生显著影响,因此需要特别关注。新颖点 (Novelty):指在训练集未出现过的新模式或新实例。与异常值不同,新颖点 (Novelty)并不一定是错误或噪声,而是代表了新的信息或趋势。在某些情况下异常值 (Outliers)可能是值得进一步研究的潜在重要发现。
异常值检测 和新颖性检测 均用于异常检测 ,人们感兴趣的是检测异常 或不寻常的观察结果 。异常值检测 也称为无监督异常检测 ,而新颖性检测 则称为半监督异常检测 。在异常值检测 中,异常值/异常不能形成密集簇,因为可用的估计器假设异常值/异常位于低密度区域。相反,在新颖性检测 中,只要新颖性/异常位于训练数据的低密度区域,它们就可以形成密集簇 ,在这种情况下被视为正常。
局部异常因子(LOF) 局部异常因子 (LOF)是应用最广泛的无监督的局部异常检测算法 。它采用最近邻居的思想来确定异常 或离群值分数 。它计算数据点相对于其邻居的局部密度偏差 。它将密度明显低于邻居的样本视为离群值 。简单来说,局部异常因子 (LOF)将一个数据点的局部密度 与其局部密度 进行比较,并给出一个分数作为最终输出。
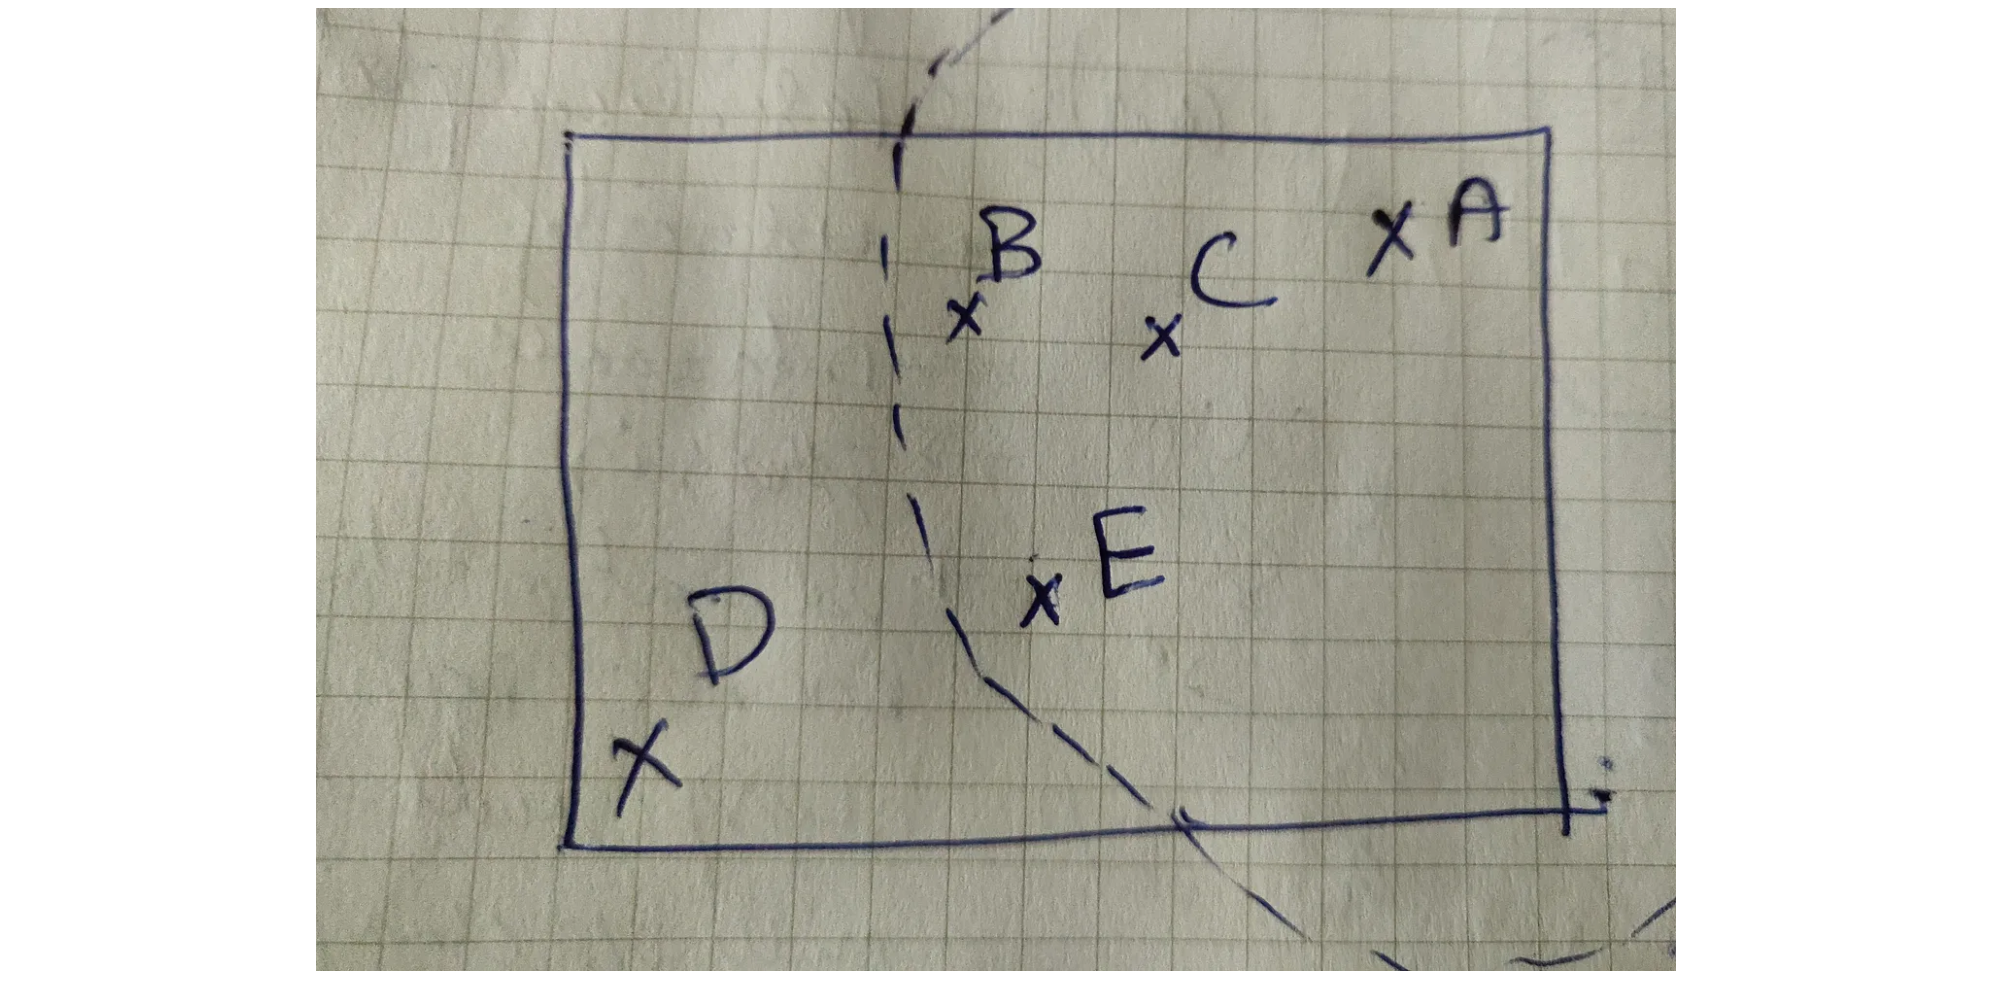
k-distance表示一个数据点到其第A数据点的局部异常因子 (LOF),k-distance表示与A数据点排第三距离最近的的数据点,这里是数据点E。可达距离 (RD)代表为相邻点的k-distance与两点之间距离最大值。从数据点A到数据点B,则局部可达密度 (LRD)的计算公式为:A点的局部异常因子 (LOF),这里需要三个步骤:1.必须为每个数据点(假设为2.使用局部可达密度 (LRD)来估计数据点的局部密度 。3.最后,通过将一条记录的LRD与其LRD进行比较来计算LOF分数。局部异常因子 (LOF)的计算公式为:A的局部异常因子 (LOF)LRD,则
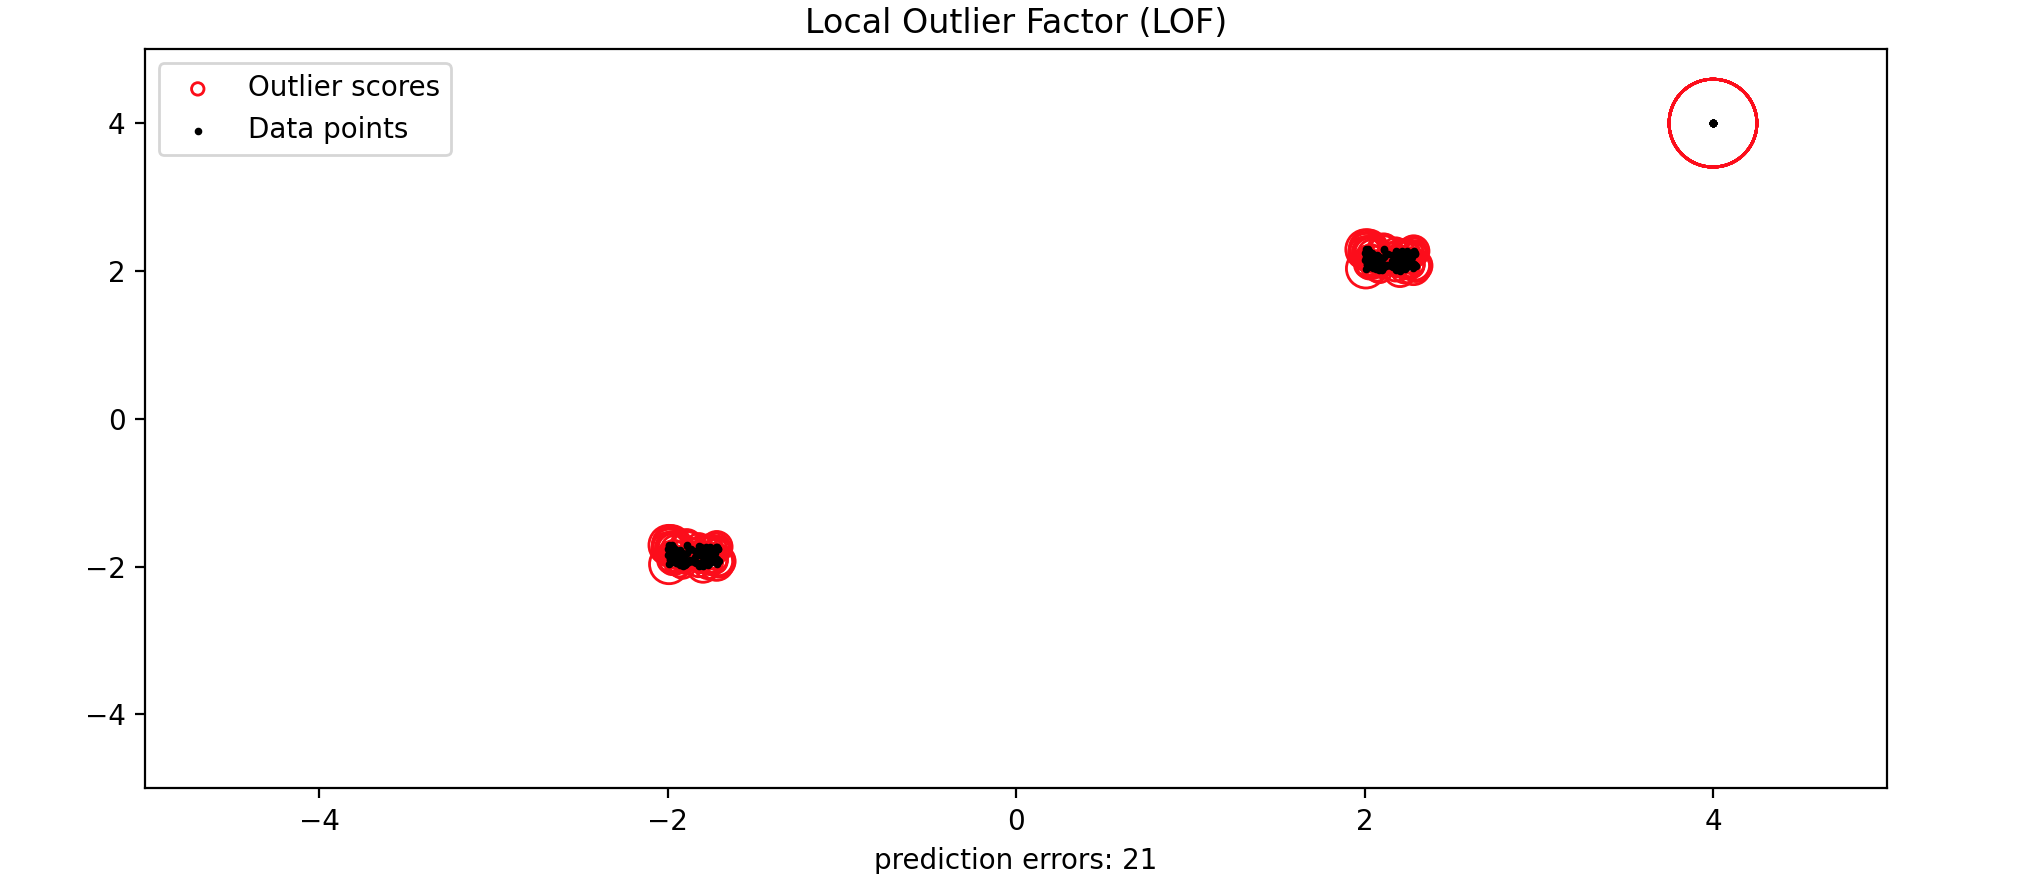
1 2 3 4 5 6 7 8 9 10 11 12 13 14 15 16 17 18 19 20 21 22 23 24 25 26 27 28 29 30 31 32 33 34 35 36 37 38 39 40 41 42 43 44 45 46 from matplotlib.legend_handler import HandlerPathCollectionimport matplotlib.pyplot as pltfrom sklearn.neighbors import LocalOutlierFactorimport numpy as npnp.random.seed(42 ) X_inliers = 0.3 * np.random.rand(100 , 2 ) X_inliers = np.r_[X_inliers + 2 , X_inliers - 2 ] X_outliers = np.random.uniform(low=4 , high=4 , size=(20 , 2 )) X = np.r_[X_inliers, X_outliers] n_outliers = len (X_outliers) ground_truth = np.ones(len (X), dtype=int ) ground_truth[-n_outliers] = -1 clf = LocalOutlierFactor(n_neighbors=20 , contamination=0.1 ) y_pred = clf.fit_predict(X) n_errors = (y_pred != ground_truth).sum () X_scores = clf.negative_outlier_factor_ def update_legend_marker_size (handle, orig ): "Customize size of the legend marker" handle.update_from(orig) handle.set_sizes([20 ]) radius = (X_scores.max () - X_scores) / (X_scores.max () - X_scores.min ()) scatter = plt.scatter( X[:, 0 ], X[:, 1 ], s=1000 * radius, edgecolors="r" , facecolors="none" , label="Outlier scores" , ) plt.scatter(X[:, 0 ], X[:, 1 ], color="k" , s=3.0 , label="Data points" ) plt.axis("tight" ) plt.xlim((-5 , 5 )) plt.ylim((-5 , 5 )) plt.xlabel("prediction errors: %d" % (n_errors)) plt.legend(handler_map={scatter: HandlerPathCollection(update_func=update_legend_marker_size)}) plt.title("Local Outlier Factor (LOF)" ) plt.show()
拟合椭圆包络(Fitting an elliptic envelope) 拟合椭圆包络 (Fitting an elliptic envelope)是一种用于异常检测 的机器学习算法,主要用于识别多维数据中的异常值 。该算法假设数据点遵循高斯分布 ,并试图找到一个最小体积的椭球体,以包围正常数据。任何落在此估计椭球体之外的数据点都被视为异常值 。拟合椭圆包络 (Fitting an elliptic envelope)算法的原理是:高斯分布假设 ,数据点被认为是从多维高斯分布 中生成的;椭球体拟合 ,算法通过计算数据的均值 和协方差矩阵 ,拟合出一个椭球体,该椭球体能够覆盖大部分正常数据;异常值判定 ,任何位于此椭球体外的数据点被标记为异常值 。拟合椭圆包络 (Fitting an elliptic envelope)是一种有效的异常检测工具,适用于许多实际应用,如金融欺诈检测 、网络安全 等领域。通过合理设置参数和理解其假设,可以有效识别并处理数据中的异常值 。
下面有一个实例,鲁棒协方差估计与马哈拉诺比斯距离的相关性 。鲁棒协方差 估计是一种用于异常检测 的技术,特别适用于高斯分布 的数据。马哈拉诺比斯距离 是一种衡量一个点与分布之间距离的方法,它通过分布的均值 和协方差矩阵 来进行计算。其原理为:高斯分布假设 ,在高斯分布 的数据中,马哈拉诺比斯距离 可以用来计算观测值 与分布模式 之间的距离;协方差矩阵的影响 ,标准的最大似然估计器 (MLE)对数据集中异常值非常敏感,因此计算出的马哈拉诺比斯距离 也会受到影响。为了确保估计结果能够抵抗“错误”观测值的干扰,使用鲁棒的协方差估计器 是更好的选择;最小协方差行列式估计器 (MCD):MCD是一种鲁棒的协方差估计器 ,具有高抗干扰能力。它通过寻找具有最小行列式的样本子集,从而计算出更准确的协方差矩阵 。
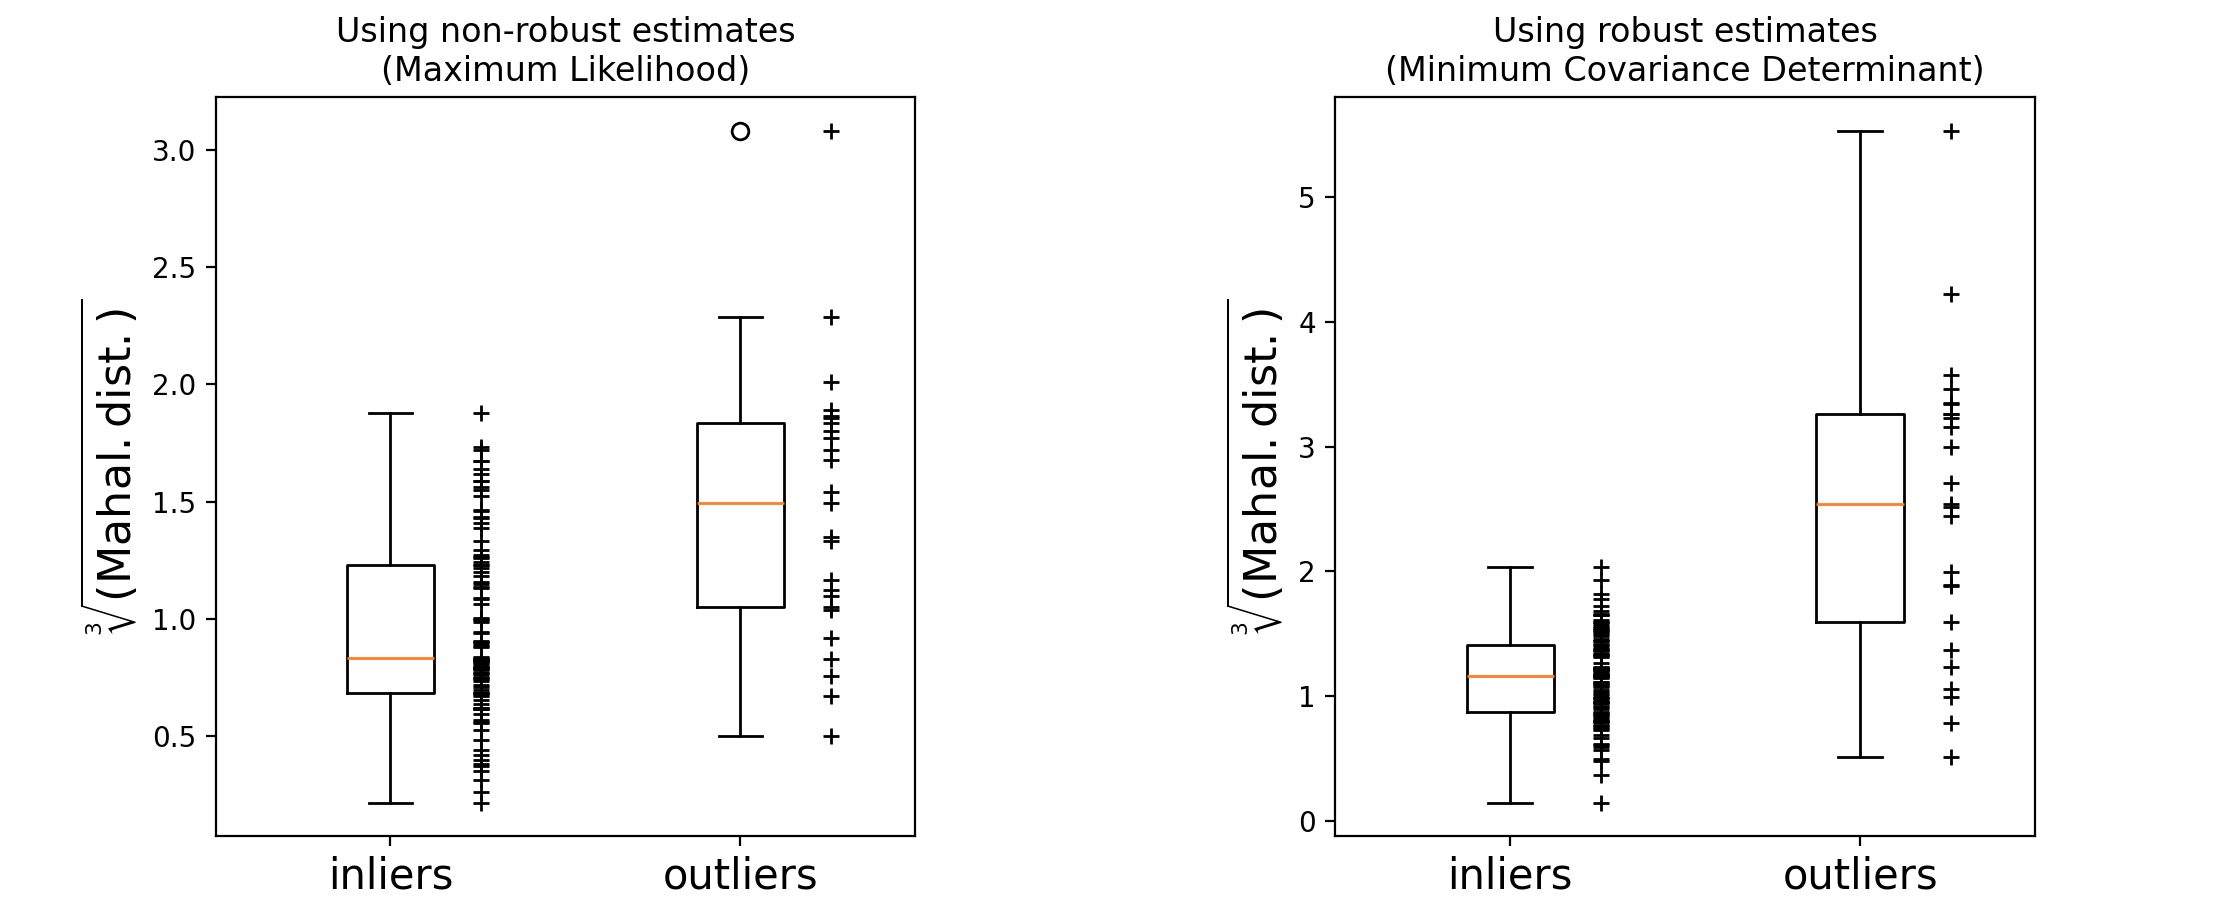
这里的马哈拉诺比斯距离 计算公式:鲁棒的协方差估计器 来保证估计值能够抵抗数据集中的“错误”观测值,并且计算出的马哈拉诺比斯距离 准确反映观测值的真实性。最小协方差行列式估计器 (MCD)是一个鲁棒的、高抗干扰能力的协方差估计器。MCD是为了找到马哈拉诺比斯距离 如何受到异常数据的影响。当使用最大似然估计 (MLE)的马哈拉诺比斯距离 时,从污染分布中得出的观测值与来自真实高斯分布 的观测值无法得到区分。使用基于最小协方差行列式估计器 (MCD)的马哈拉诺比斯距离 ,这两个群体变得可以区分。
1 2 3 4 5 6 7 8 9 10 11 12 13 14 15 16 17 18 19 20 import numpy as npnp.random.seed(7 ) n_samples = 125 n_outliers = 25 n_features = 2 gen_cov = np.eye(n_features) gen_cov[0 , 0 ] = 2.0 X = np.dot(np.random.randn(n_samples, n_features), gen_cov) outliers_cov = np.eye(n_features) outliers_cov[np.arange(1 , n_features), np.arange(1 , n_features)] = 7.0 X[-n_outliers:] = np.dot(np.random.randn(n_outliers, n_features), outliers_cov)
下面,将基于MCD和MLE的协方差估计器 拟合到我们的数据中,并打印估计器的协方差矩阵 。请注意,使用基于最大似然估计器 (MLE)估计的特征2的方差比使用最小协方差行列式估计器 (MCD)估计的特征2的方差高得多。这表明基于最小协方差行列式估计器 (MCD)的鲁棒协方差估计对异常样本的抵抗力更强,这些样本在特征2中具有更大的方差。
1 2 3 4 5 6 7 8 import matplotlib.pyplot as pltfrom sklearn.covariance import EmpiricalCovariance, MinCovDetrobust_cov = MinCovDet().fit(X) emp_cov = EmpiricalCovariance().fit(X) print ("Estimated covariance matrix:\nMCD (Robust):\n{}\nMLE:\n{}" .format (robust_cov.covariance_, emp_cov.covariance_))
结果输出为:
1 2 MCD: [[ 3.26253567e+00 -3.06695631e-03] [-3.06695631e-03 1.22747343e+00]] MLE: [[ 3.23773583 -0.24640578] [-0.24640578 7.51963999]]
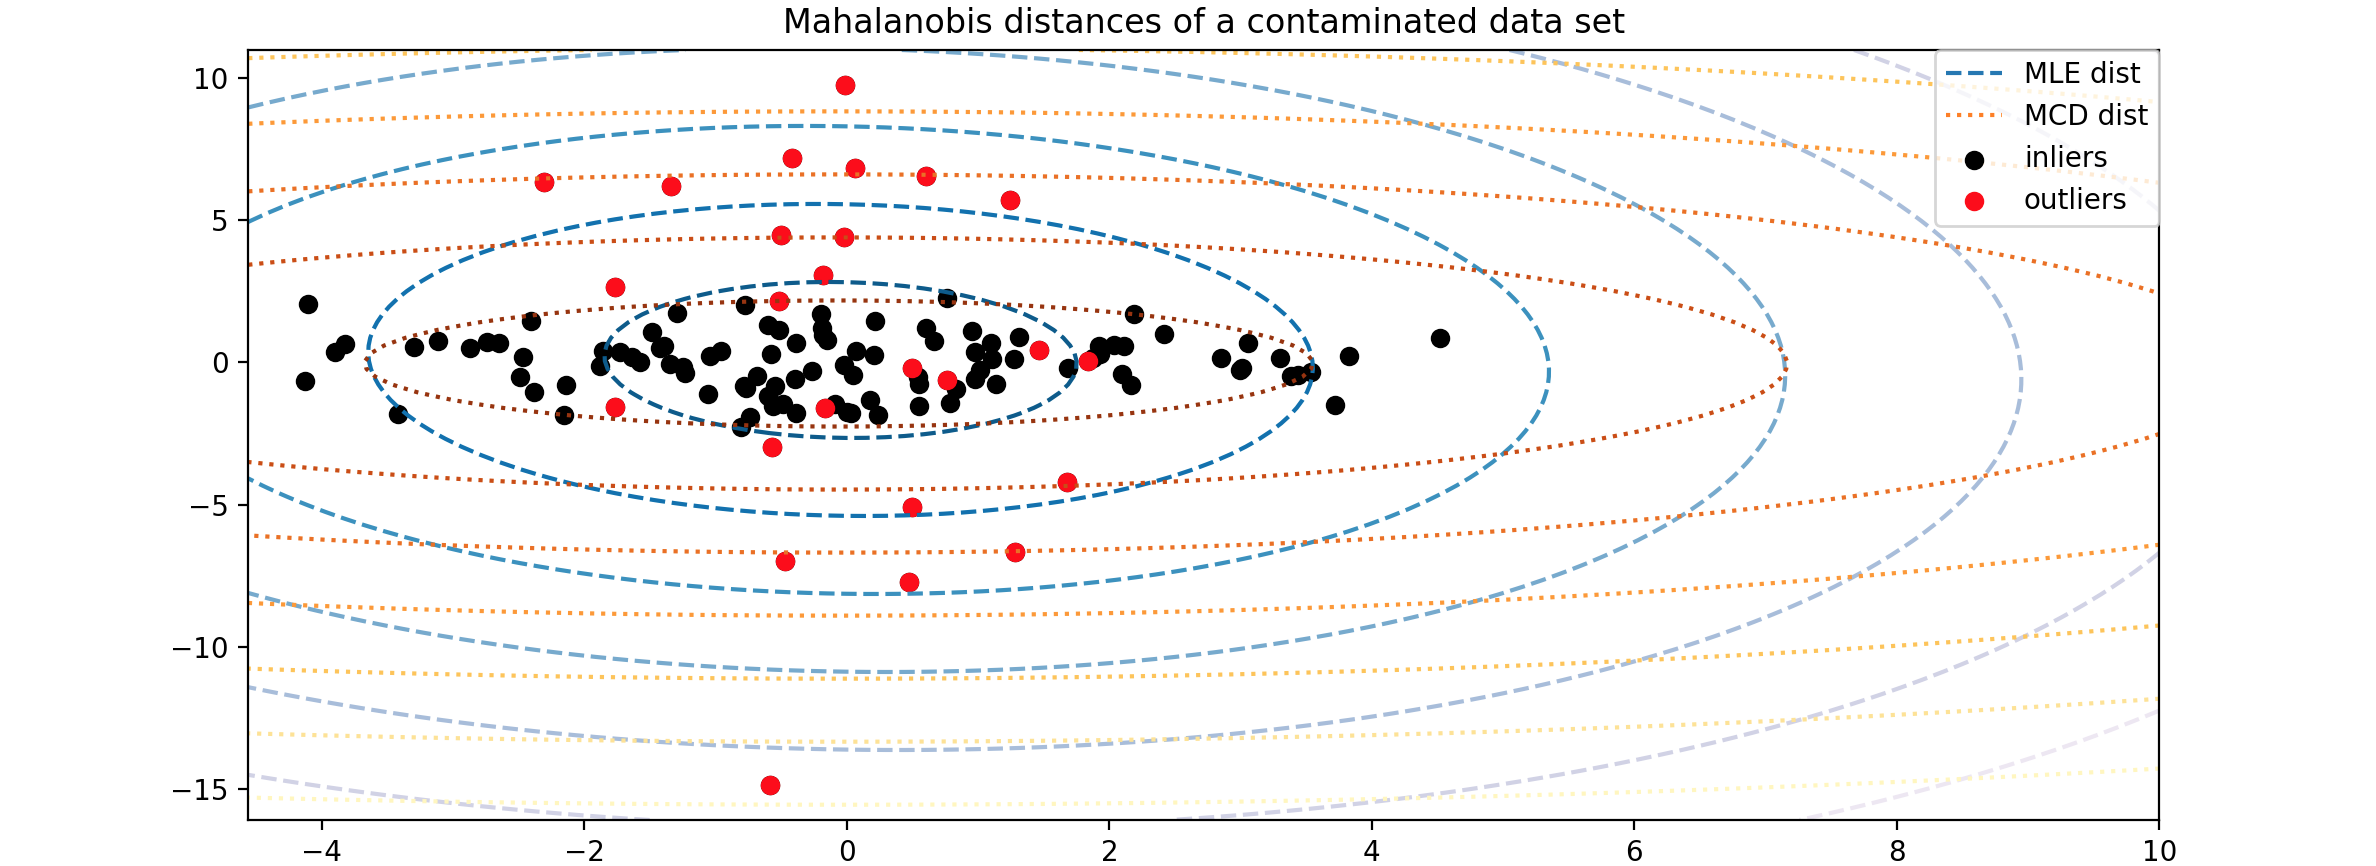
为了更直观地展示差异,绘制这两种方法(MCD,MLE)计算出的马哈拉诺比斯距离 的轮廓。请注意,基于鲁棒MCD的马哈拉诺比斯距离 更适合内部黑点,而基于MLE的马哈拉诺比斯距离 则受外部红点的影响更大。
1 2 3 4 5 6 7 8 9 10 11 12 13 14 15 16 17 18 19 20 21 22 23 24 25 26 27 28 29 30 31 32 33 34 35 36 37 38 39 40 41 42 43 44 import matplotlib.lines as mlinesfig, ax = plt.subplots(figsize=(10 , 5 )) inlier_plot = ax.scatter(X[:, 0 ], X[:, 1 ], color="black" , label="inliers" ) outlier_plot = ax.scatter( X[:, 0 ][-n_outliers:], X[:, 1 ][-n_outliers:], color="red" , label="outliers" ) ax.set_xlim(ax.get_xlim()[0 ], 10.0 ) ax.set_title("Mahalanobis distances of a contaminated data set" ) xx, yy = np.meshgrid( np.linspace(plt.xlim()[0 ], plt.xlim()[1 ], 100 ), np.linspace(plt.ylim()[0 ], plt.ylim()[1 ], 100 ), ) zz = np.c_[xx.ravel(), yy.ravel()] mahal_emp_cov = emp_cov.mahalanobis(zz) mahal_emp_cov = mahal_emp_cov.reshape(xx.shape) emp_cov_contour = plt.contour( xx, yy, np.sqrt(mahal_emp_cov), cmap=plt.cm.PuBu_r, linestyles="dashed" ) mahal_robust_cov = robust_cov.mahalanobis(zz) mahal_robust_cov = mahal_robust_cov.reshape(xx.shape) robust_contour = ax.contour( xx, yy, np.sqrt(mahal_robust_cov), cmap=plt.cm.YlOrBr_r, linestyles="dotted" ) ax.legend( [ mlines.Line2D([], [], color="tab:blue" , linestyle="dashed" ), mlines.Line2D([], [], color="tab:orange" , linestyle="dotted" ), inlier_plot, outlier_plot, ], ["MLE dist" , "MCD dist" , "inliers" , "outliers" ], loc="upper right" , borderaxespad=0 , ) plt.show()
如何基于马哈拉诺比斯距离 来区分异常值?对马哈拉诺比斯距离取立方根,得到近似正态分布,然后用箱线图绘制正常和异常样本的值。从下图所示,可以看出基于鲁棒MCD的马哈拉诺比斯距离 ,异常值样本的分布比正常值样本的分布更加分离。
1 2 3 4 5 6 7 8 9 10 11 12 13 14 15 16 17 18 19 20 21 22 23 24 25 26 27 28 29 30 31 32 33 34 35 36 fig, (ax1, ax2) = plt.subplots(1 , 2 ) plt.subplots_adjust(wspace=0.6 ) emp_mahal = emp_cov.mahalanobis(X - np.mean(X, 0 )) ** (0.33 ) ax1.boxplot([emp_mahal[:-n_outliers], emp_mahal[-n_outliers:]], widths=0.25 ) ax1.plot( np.full(n_samples - n_outliers, 1.26 ), emp_mahal[:-n_outliers], "+k" , markeredgewidth=1 , ) ax1.plot(np.full(n_outliers, 2.26 ), emp_mahal[-n_outliers:], "+k" , markeredgewidth=1 ) ax1.axes.set_xticklabels(("inliers" , "outliers" ), size=15 ) ax1.set_ylabel(r"$\sqrt[3]{\rm{(Mahal. dist.)}}$" , size=16 ) ax1.set_title("Using non-robust estimates\n(Maximum Likelihood)" ) robust_mahal = robust_cov.mahalanobis(X - robust_cov.location_) ** (0.33 ) ax2.boxplot([robust_mahal[:-n_outliers], robust_mahal[-n_outliers:]], widths=0.25 ) ax2.plot( np.full(n_samples - n_outliers, 1.26 ), robust_mahal[:-n_outliers], "+k" , markeredgewidth=1 , ) ax2.plot(np.full(n_outliers, 2.26 ), robust_mahal[-n_outliers:], "+k" , markeredgewidth=1 ) ax2.axes.set_xticklabels(("inliers" , "outliers" ), size=15 ) ax2.set_ylabel(r"$\sqrt[3]{\rm{(Mahal. dist.)}}$" , size=16 ) ax2.set_title("Using robust estimates\n(Minimum Covariance Determinant)" ) plt.show()
孤立森林(Isolation Forest) 孤立森林 (Isolation Forest)是一种用于异常检测 的无监督学习算法 ,最初由Fei Tony Liu等人在2008年提出。该算法通过构建多个二叉树来识别数据中的异常点 ,具有线性时间复杂度和低内存使用,特别适合处理高维数据。孤立森林 (Isolation Forest)的核心原理是:构建隔离树 ,算法随机选择一个特征 和一个分割值 ,将数据集分割成两个部分。这一过程会递归进行,直到每个数据点都被隔离到一个独立的叶节点;路径长度 ,每个数据点从根节点到达叶节点所经过的边数称为路径长度 。对于异常点,由于其特性,通常需要更少的分割(即更短的路径)就能被隔离。因此,路径长度 越短,表示该点越可能是异常;异常分数 ,算法通过计算每个数据点在所有隔离树中的平均路径长度 来确定其异常分数 。分数越低,表明该点越可能是异常。具体而言,异常分数 可以通过以下公式计算:平均路径长度 ,平均路径长度 。其主要应用于金融欺诈检测、网络安全、制造业等领域。孤立森林 (Isolation Forest)是一种高效且灵活的异常检测工具 ,通过随机分割和路径长度来识别数据中的异常点。
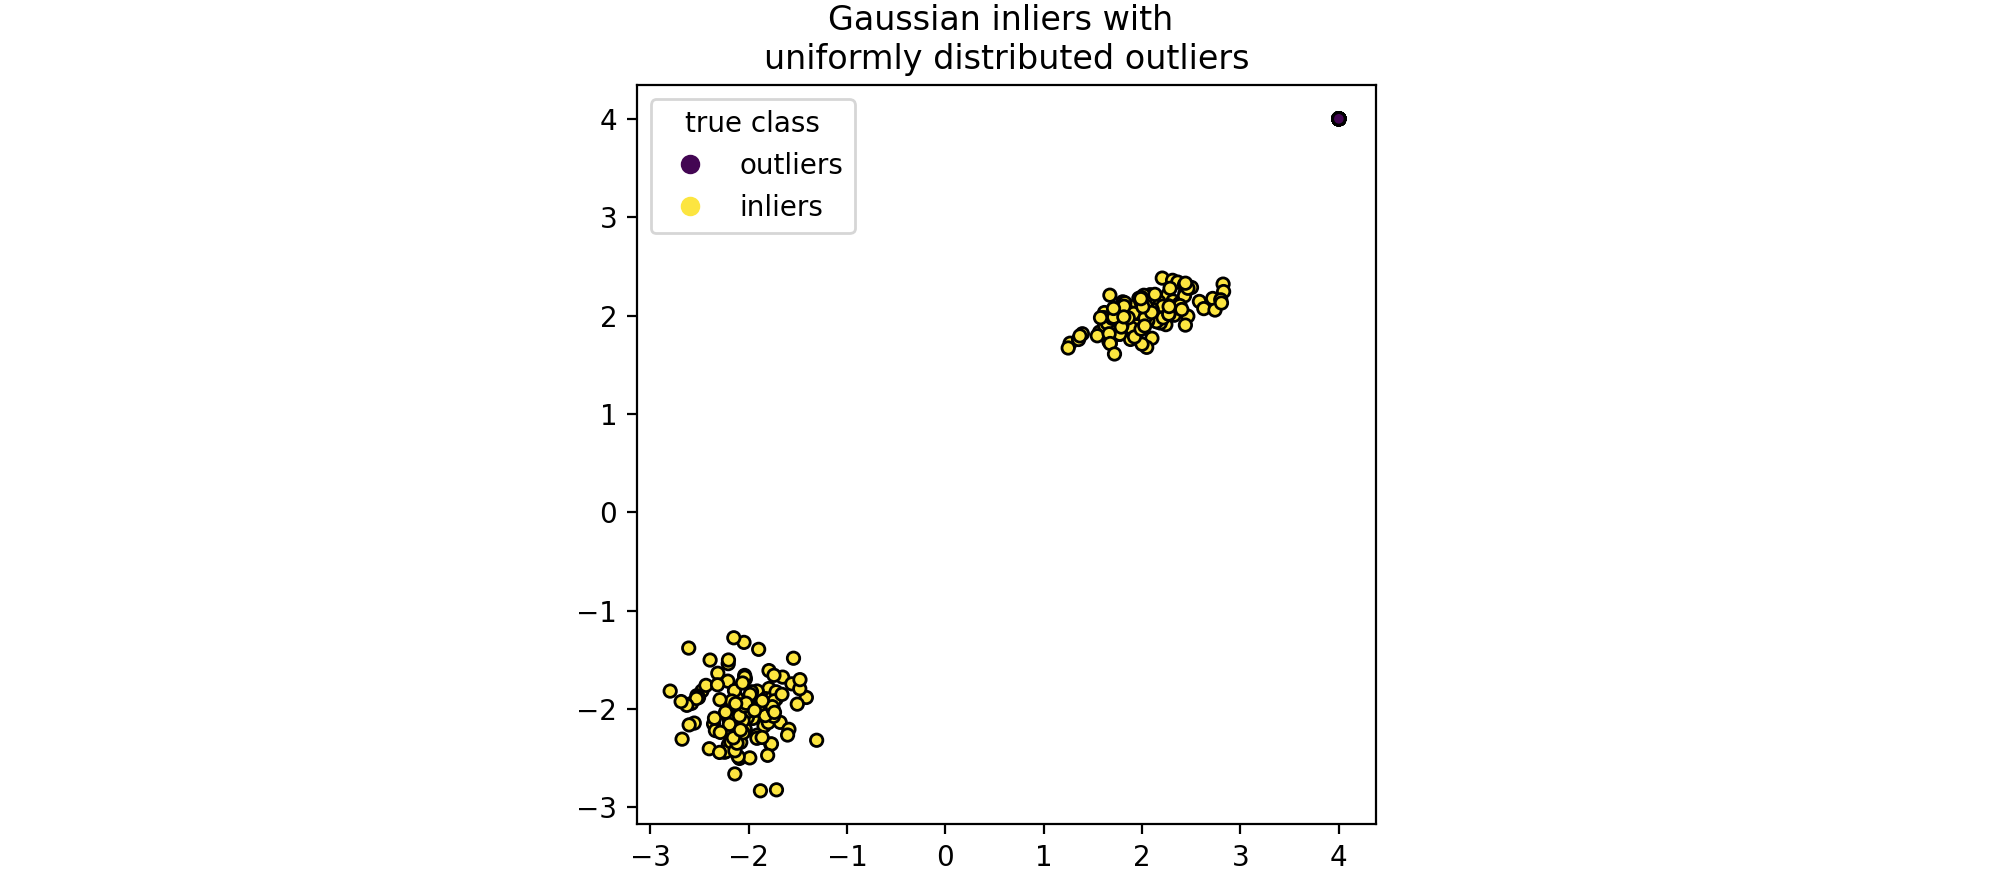
孤立森林 (Isolation Forest)是一组“孤立树 ”,通过递归随机分割 来“隔离 ”观测值,可以用树结构表示。隔离样本所需的分割次数对于异常值较低,而对于正常值较高。现在有一个孤立森林 (Isolation Forest)的例子,在玩具数据集上训练的孤立森林 (Isolation Forest)的决策边界。
1 2 3 4 5 6 7 8 9 10 11 12 13 14 15 16 17 18 19 20 21 22 import numpy as npfrom sklearn.model_selection import train_test_splitimport matplotlib.pyplot as pltn_samples, n_outliers = 120 , 40 rng = np.random.RandomState(0 ) covariance = np.array([[0.5 , -0.1 ], [0.7 , 0.4 ]]) cluster_1 = 0.4 * rng.randn(n_samples, 2 ) @ covariance + np.array([2 , 2 ]) cluster_2 = 0.3 * rng.randn(n_samples, 2 ) + np.array([-2 , -2 ]) outliers = rng.uniform(low=-4 , high=4 , size=(n_outliers, 2 )) X = np.concatenate([cluster_1, cluster_2, outliers]) y = np.concatenate([np.ones((2 * n_samples), dtype=int ), -np.ones((n_outliers), dtype=int )]) X_train, X_test, y_train, y_test = train_test_split(X, y, stratify=y, random_state=42 ) scatter = plt.scatter(X[:, 0 ], X[:, 1 ], c=y, s=20 , edgecolor="k" ) handles, labels = scatter.legend_elements() plt.axis("square" ) plt.legend(handles=handles, labels=["outliers" , "inliers" ], title="true class" ) plt.title("Gaussian inliers with \nuniformly distributed outliers" ) plt.show()
创建孤立森林 (Isolation Forest),代码实现为:
1 2 3 4 from sklearn.ensemble import IsolationForestclf = IsolationForest(max_samples=100 , random_state=0 ) clf.fit(X_train)
结果输出为:
1 IsolationForest(max_samples=100, random_state=0)
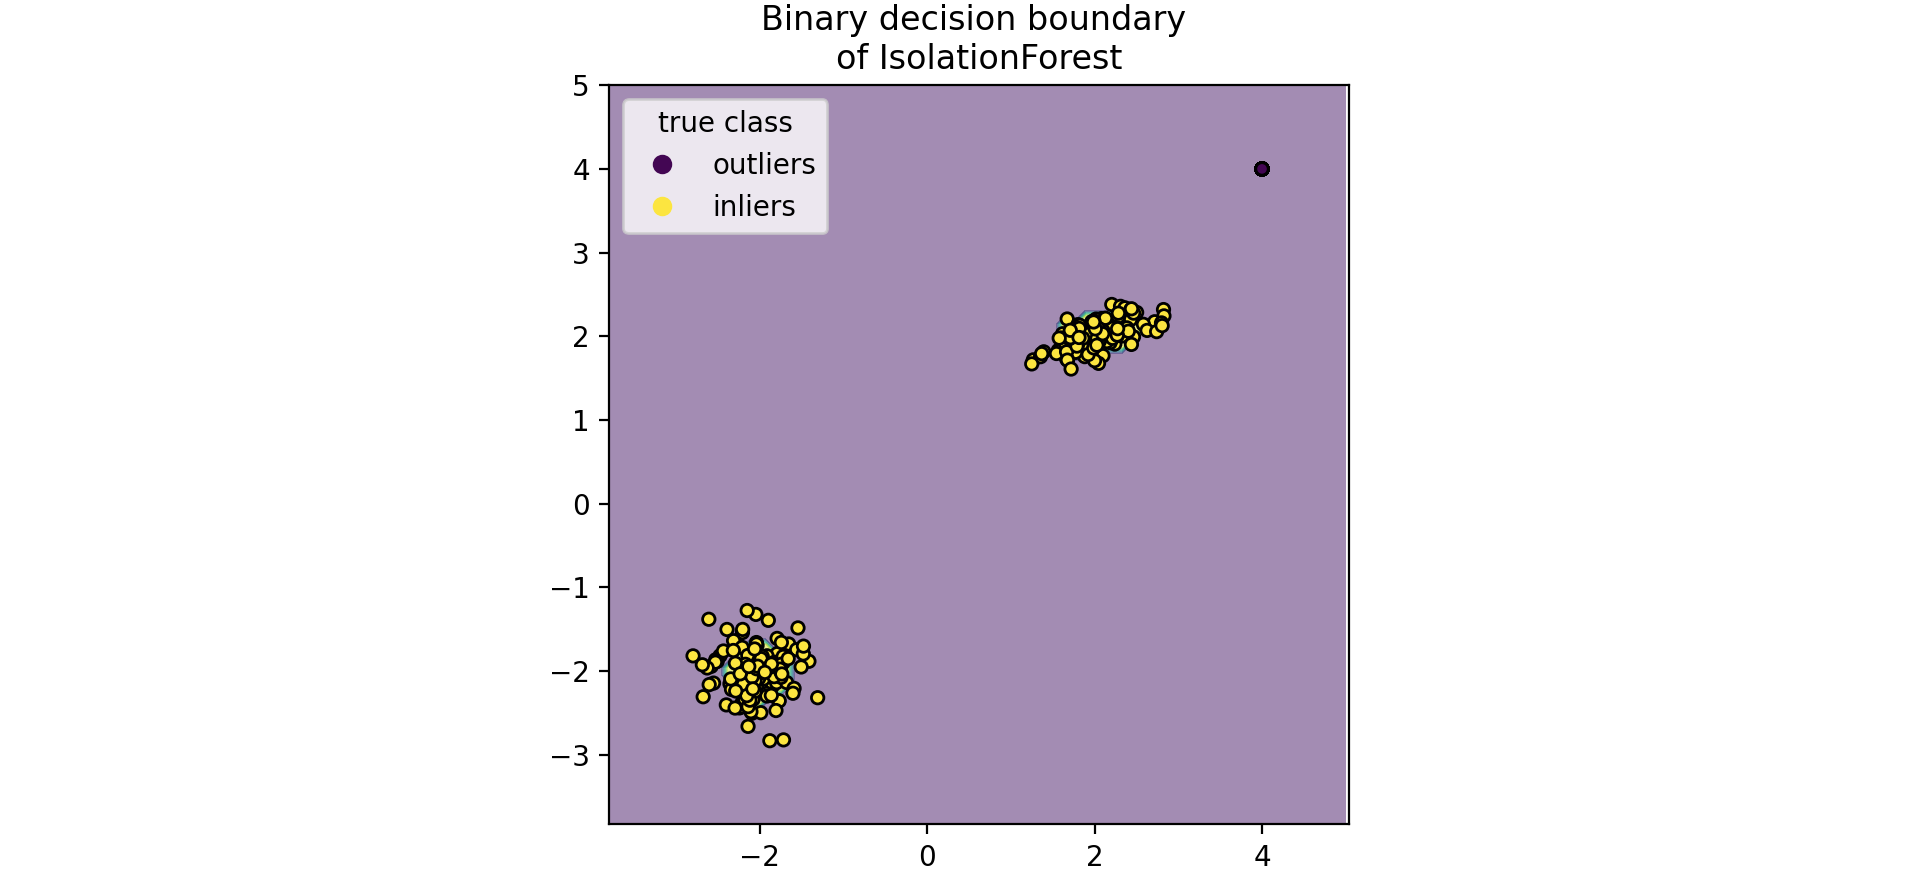
绘制离散决策边界 ,背景颜色表示该给定区域中的样本是否被预测为异常值。散点图显示真实标签。
1 2 3 4 5 6 7 8 9 10 11 12 13 14 import matplotlib.pyplot as pltfrom sklearn.inspection import DecisionBoundaryDisplaydisp = DecisionBoundaryDisplay.from_estimator( clf, X, response_method="predict" , alpha=0.5 , ) disp.ax_.scatter(X[:, 0 ], X[:, 1 ], c=y, s=20 , edgecolor="k" ) disp.ax_.set_title("Binary decision boundary \nof IsolationForest" ) plt.axis("square" ) plt.legend(handles=handles, labels=["outliers" , "inliers" ], title="true class" ) plt.show()
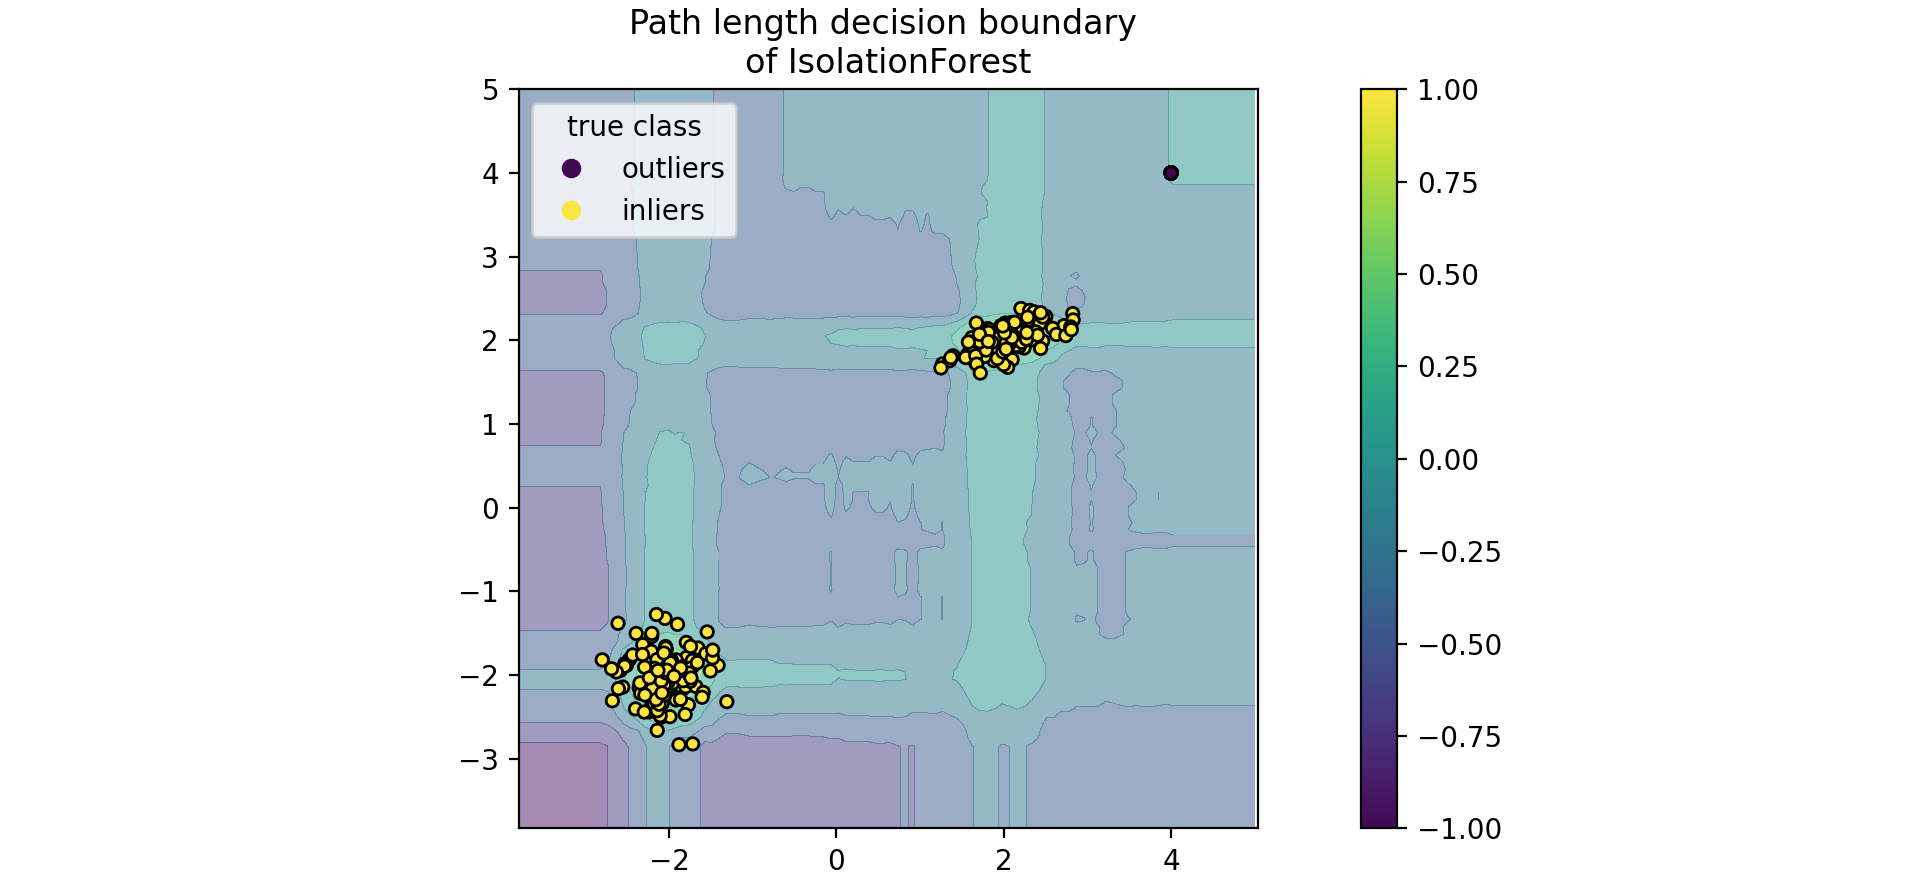
绘制路径长度的决策边界 ,当一组随机树共同产生较短的路径长度 并隔离某些特定样本时,该数据点很可能是异常值,正态性度量 接近0。同样,较大的路径长度正态性度量 接近1,该数据点很可能是正常值。
1 2 3 4 5 6 7 disp = DecisionBoundaryDisplay.from_estimator(clf,X,response_method="decision_function" ,alpha=0.5 ,) disp.ax_.scatter(X[:, 0 ], X[:, 1 ], c=y, s=20 , edgecolor="k" ) disp.ax_.set_title("Path length decision boundary \nof IsolationForest" ) plt.axis("square" ) plt.legend(handles=handles, labels=["outliers" , "inliers" ], title="true class" ) plt.colorbar(disp.ax_.collections[1 ]) plt.show()
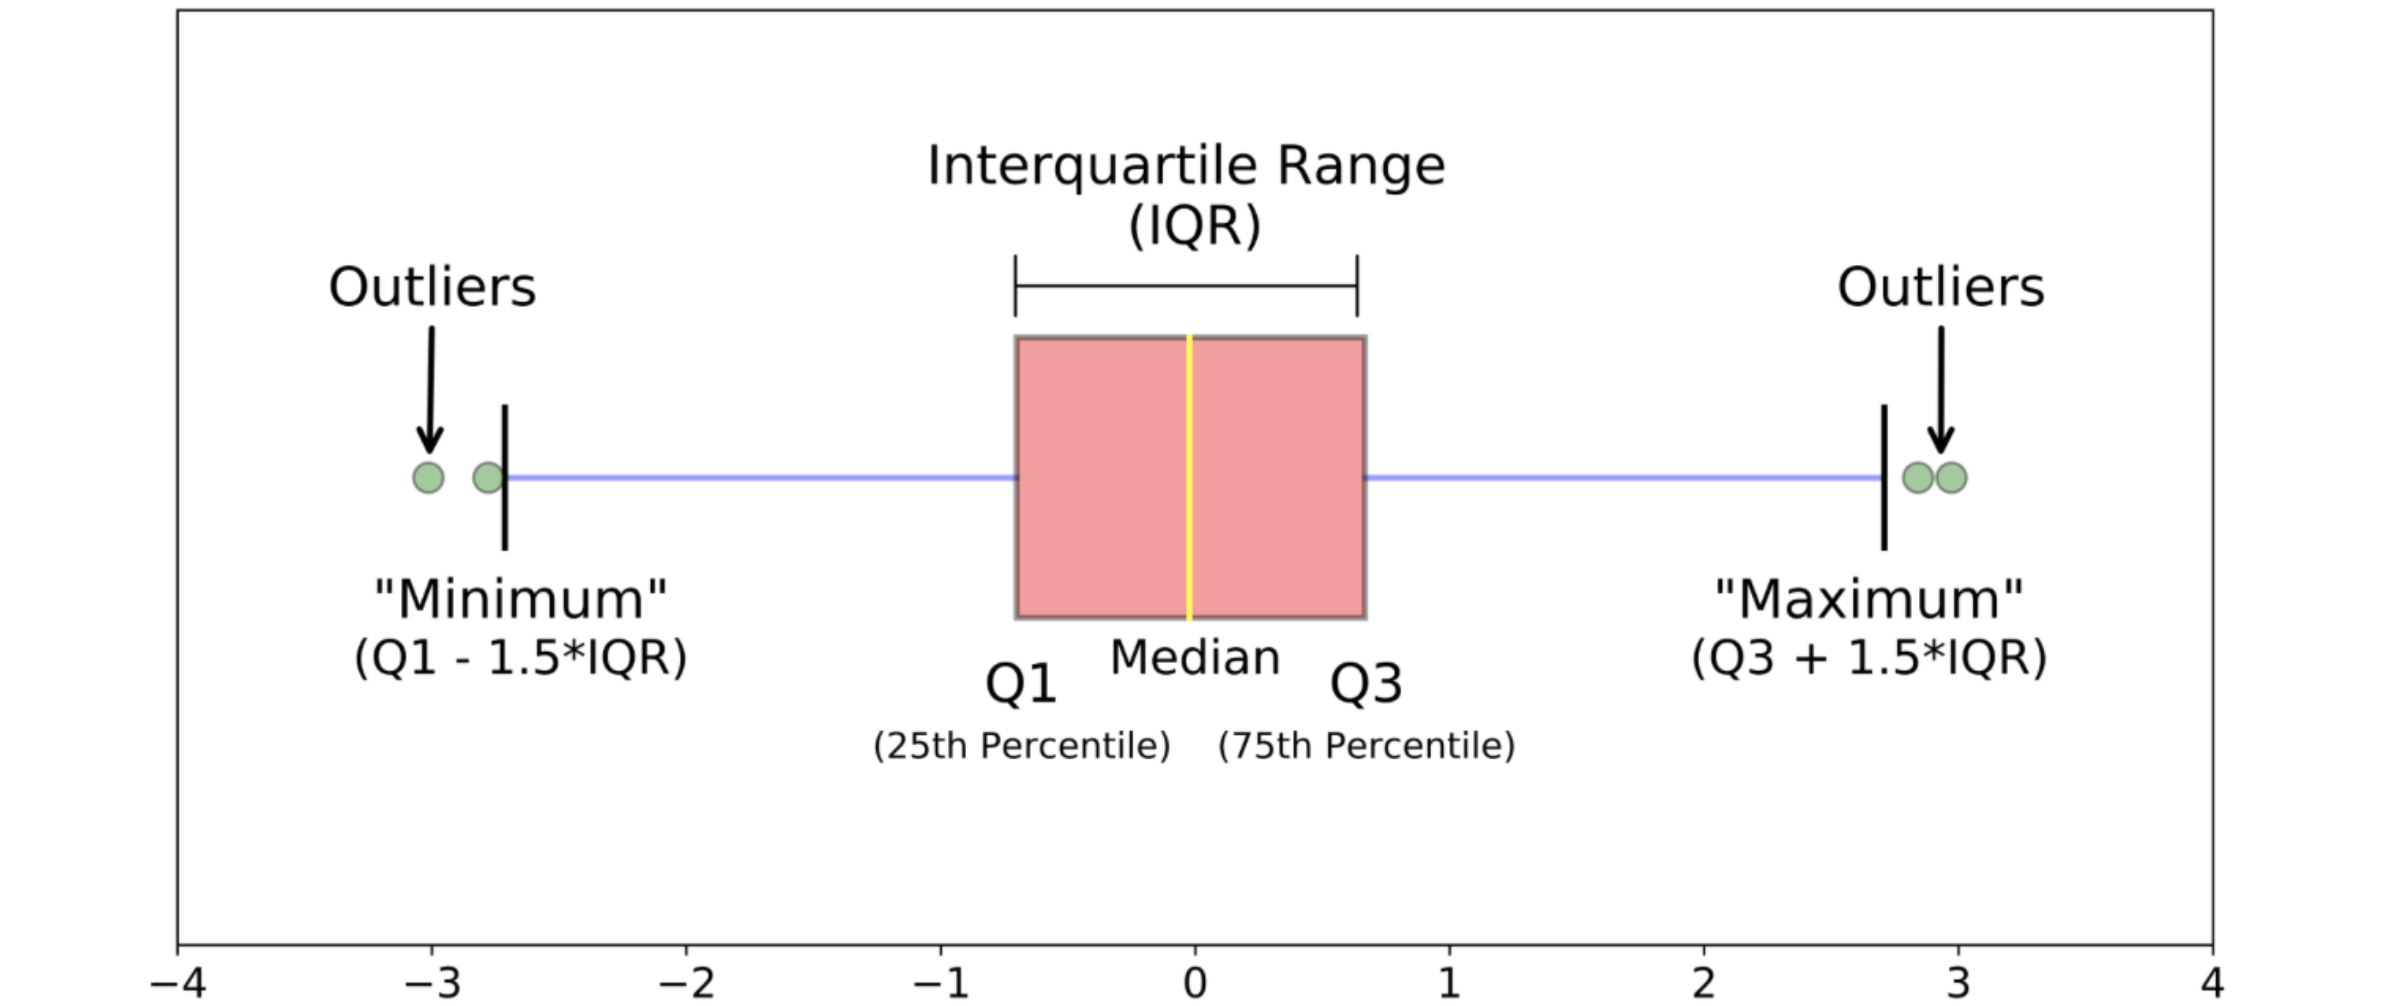
Tukey’s IQR方法 Tukey's IQR方法用于检测倾斜或非钟形数据中的异常值,因为它不做任何分布假设。但是,Tukey's IQR方法可能不适用于小样本量。一般规则是,任何不在(Q1 - 1.5IQR)~(Q3 + 1.5IQR)范围内的值都是异常值,可以删除。Tukey's IQR是通过将数据集划分为四个部分来衡量数据变异性的一种方法。具体来说:
Q1(第一个四分位数)是将数据按升序排列后,前25%的数据点落在其以下的值。Q3(第三个四分位数)是后75%的数据点落在其以下的值。
四分位距离的计算公式为:Tukey's IQR的界限定义为下界 :上界 为:下界 或高于上界 的数据点都被视为异常值。
举例说明,这里的数据集包含欧洲持卡人在2013年9月使用信用卡进行的交易。该数据集显示两天内发生的交易,在284,807笔交易中,有492笔是欺诈交易。该数据集高度不平衡,欺诈交易占所有交易的0.172%。它仅包含数值输入变量,这些变量是PCA转换的结果。特征V1、V2、…V28是通过PCA获得的主要组成,唯一未通过PCA转换的特征是“时间”(Time)和“金额”(Amount)。特征“时间”(Time)包含数据集中每笔交易与第一笔交易之间经过的秒数。特征“金额”(Amount)是交易金额,此特征可用于基于示例的成本敏感学习。特征“类别”(Class)是响应变量,在欺诈情况下取值为1,否则取值为0。
1 2 3 4 5 6 7 8 9 10 11 12 13 14 15 16 17 18 19 20 21 22 23 24 25 26 27 28 29 30 31 32 33 34 35 36 37 38 39 40 41 42 43 44 45 46 47 48 49 50 51 52 53 54 55 56 57 58 59 60 61 62 63 64 65 66 67 68 69 70 71 72 73 74 75 76 77 78 79 80 81 82 83 84 85 86 87 88 import numpy as npimport pandas as pdimport seaborn as snsfrom matplotlib import pyplot as pltfrom collections import Counterdf_raw = pd.read_csv('../input/fraud-detection/creditcard.csv' ) df=df_raw.drop(['Time' ], axis=1 ) feature_list = ['V1' , 'V2' , 'V3' , 'V4' , 'V5' , 'V6' , 'V7' , 'V8' , 'V9' , 'V10' , 'V11' ,'V12' , 'V13' , 'V14' , 'V15' , 'V16' , 'V17' , 'V18' , 'V19' , 'V20' , 'V21' ,'V22' , 'V23' , 'V24' , 'V25' , 'V26' , 'V27' , 'V28' , 'Amount' ] def IQR_method (df,n,features): """ Takes a dataframe and returns an index list corresponding to the observations containing more than n outliers according to the Tukey IQR method. """ outlier_list = [] for column in features: Q1 = np.percentile(df[column], 25 ) Q3 = np.percentile(df[column],75 ) IQR = Q3 - Q1 outlier_step = 1.5 * IQR outlier_list_column = df[(df[column] < Q1 - outlier_step) | (df[column] > Q3 + outlier_step )].index outlier_list.extend(outlier_list_column) outlier_list = Counter(outlier_list) multiple_outliers = list ( k for k, v in outlier_list.items() if v > n ) df1 = df[df[column] < Q1 - outlier_step] df2 = df[df[column] > Q3 + outlier_step] print ('Total number of outliers is:' , df1.shape[0 ]+df2.shape[0 ]) return multiple_outliers Outliers_IQR = IQR_method(df,1 ,feature_list) df_out = df.drop(Outliers_IQR, axis = 0 ).reset_index(drop=True ) fig, axes = plt.subplots(nrows=3 , ncols=3 ,figsize=(13 ,8 )) fig.suptitle('Distributions of most important features after dropping outliers using IQR Method\n' , size = 18 ) axes[0 ,0 ].hist(df_out['V17' ], bins=60 , linewidth=0.5 , edgecolor="white" ) axes[0 ,0 ].set_title("V17 distribution" ); axes[0 ,1 ].hist(df_out['V10' ], bins=60 , linewidth=0.5 , edgecolor="white" ) axes[0 ,1 ].set_title("V10 distribution" ); axes[0 ,2 ].hist(df_out['V12' ], bins=60 , linewidth=0.5 , edgecolor="white" ) axes[0 ,2 ].set_title("V12 distribution" ); axes[1 ,0 ].hist(df_out['V16' ], bins=60 , linewidth=0.5 , edgecolor="white" ) axes[1 ,0 ].set_title("V16 distribution" ); axes[1 ,1 ].hist(df_out['V14' ], bins=60 , linewidth=0.5 , edgecolor="white" ) axes[1 ,1 ].set_title("V14 distribution" ); axes[1 ,2 ].hist(df_out['V3' ], bins=60 , linewidth=0.5 , edgecolor="white" ) axes[1 ,2 ].set_title("V3 distribution" ); axes[2 ,0 ].hist(df_out['V7' ], bins=60 , linewidth=0.5 , edgecolor="white" ) axes[2 ,0 ].set_title("V7 distribution" ); axes[2 ,1 ].hist(df_out['V11' ], bins=60 , linewidth=0.5 , edgecolor="white" ) axes[2 ,1 ].set_title("V11 distribution" ); axes[2 ,2 ].hist(df_out['V4' ], bins=60 , linewidth=0.5 , edgecolor="white" ) axes[2 ,2 ].set_title("V4 distribution" ); plt.tight_layout()
标准差(Standard deviation)方法 标准差 (Standard deviation)是一种用于识别数据集中异常值 的统计技术,基于数据的均值 和标准差 来判断哪些数据点偏离了正常范围。这种方法在许多领域中被广泛应用,尤其是在质量控制、金融分析和科学研究中。标准差 (Standard Deviation)是衡量数据集分散程度的指标。它表示数据点与均值 之间的平均距离。计算标准差 的步骤如下:
计算数据集的均值:
计算每个数据点与均值的差异,并将其平方:
计算这些平方差的平均值(方差):
最后,取方差的平方根得到标准差:
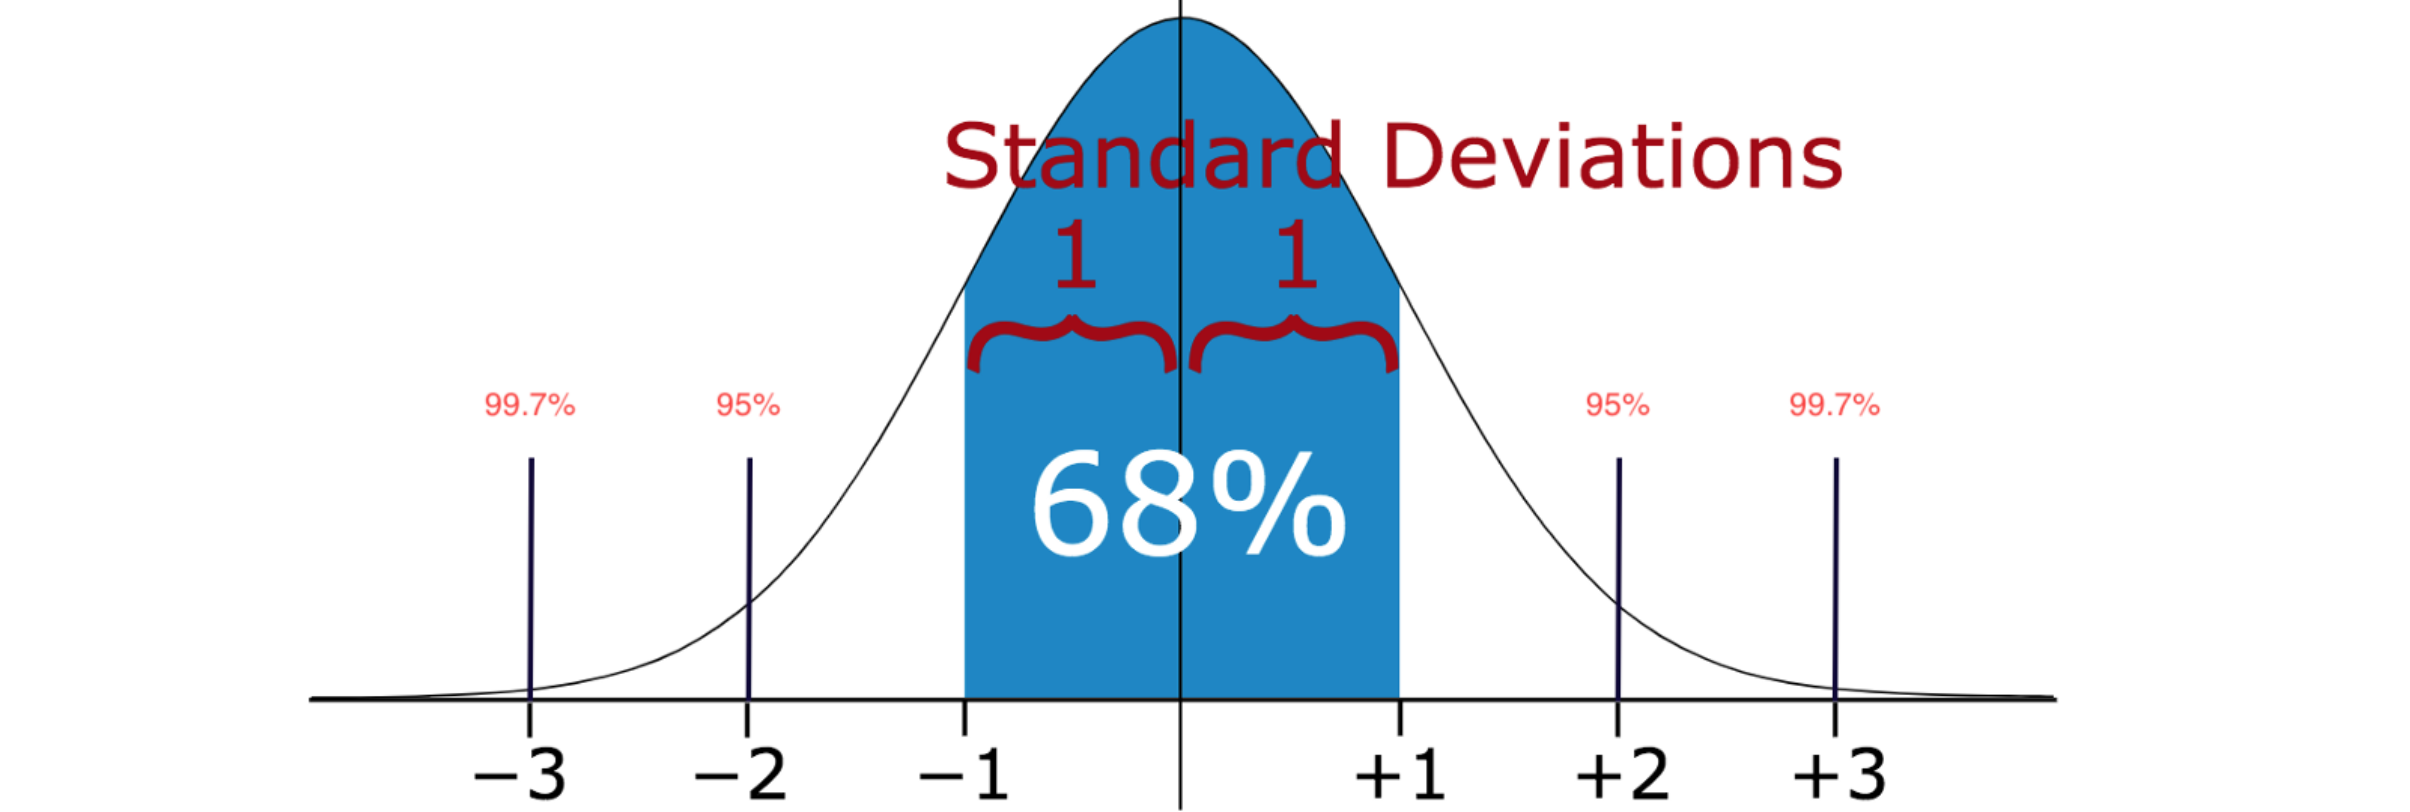
如果知道样本中值的分布是高斯分布 或类高斯分布 ,就可以使用样本的标准差 (Standard deviation)作为识别异常值的临界值。标准差 (Standard deviation)显示各个数据点与平均值之间的差异。如果数据分布为正态分布,则68%的数据值位于平均值的一个标准差内;95%的数据值位于两个标准差内;99.7%的数据值位于三个标准差内。根据设定的2倍或3倍标准差 (Standard deviation),此方法可能无法检测异常值,因为异常值会增加标准差。异常值越极端,标准差 (Standard deviation)受到的影响就越大。标准差 (Standard deviation)方法是一种直观且有效的异常值检测 工具,适用于多种应用场景。通过利用均值和标准差,它能够帮助分析师识别出潜在的问题数据,从而提高数据分析结果的可靠性。
1 2 3 4 5 6 7 8 9 10 11 12 13 14 15 16 17 18 19 20 21 22 23 24 25 26 27 28 29 30 31 32 33 34 35 36 37 38 39 40 41 42 43 44 45 46 47 48 49 50 51 52 53 54 55 56 57 58 59 60 61 62 63 64 65 66 67 68 69 70 71 72 73 74 75 76 77 78 79 80 81 82 83 import numpy as npimport pandas as pdimport seaborn as snsfrom matplotlib import pyplot as pltfrom collections import Counterdf_raw = pd.read_csv('../input/fraud-detection/creditcard.csv' ) df=df_raw.drop(['Time' ], axis=1 ) feature_list = ['V1' , 'V2' , 'V3' , 'V4' , 'V5' , 'V6' , 'V7' , 'V8' , 'V9' , 'V10' , 'V11' ,'V12' , 'V13' , 'V14' , 'V15' , 'V16' , 'V17' , 'V18' , 'V19' , 'V20' , 'V21' ,'V22' , 'V23' , 'V24' , 'V25' , 'V26' , 'V27' , 'V28' , 'Amount' ] def StDev_method (df,n,features): """ Takes a dataframe df of features and returns an index list corresponding to the observations containing more than n outliers according to the standard deviation method. """ outlier_indices = [] for column in features: data_mean = df[column].mean() data_std = df[column].std() cut_off = data_std * 3 outlier_list_column = df[(df[column] < data_mean - cut_off) | (df[column] > data_mean + cut_off)].index outlier_indices.extend(outlier_list_column) outlier_indices = Counter(outlier_indices) multiple_outliers = list ( k for k, v in outlier_indices.items() if v > n ) df1 = df[df[column] > data_mean + cut_off] df2 = df[df[column] < data_mean - cut_off] print ('Total number of outliers is:' , df1.shape[0 ]+ df2.shape[0 ]) return multiple_outliers Outliers_StDev = StDev_method(df,1 ,feature_list) df_out2 = df.drop(Outliers_StDev, axis = 0 ).reset_index(drop=True ) fig, axes = plt.subplots(nrows=3 , ncols=3 ,figsize=(13 ,8 )) fig.suptitle('Distributions of most important features after dropping outliers using Standard Deviation Method\n' , size = 18 ) axes[0 ,0 ].hist(df_out2['V17' ], bins=60 , linewidth=0.5 , edgecolor="white" ) axes[0 ,0 ].set_title("V17 distribution" ); axes[0 ,1 ].hist(df_out2['V10' ], bins=60 , linewidth=0.5 , edgecolor="white" ) axes[0 ,1 ].set_title("V10 distribution" ); axes[0 ,2 ].hist(df_out2['V12' ], bins=60 , linewidth=0.5 , edgecolor="white" ) axes[0 ,2 ].set_title("V12 distribution" ); axes[1 ,0 ].hist(df_out2['V16' ], bins=60 , linewidth=0.5 , edgecolor="white" ) axes[1 ,0 ].set_title("V16 distribution" ); axes[1 ,1 ].hist(df_out2['V14' ], bins=60 , linewidth=0.5 , edgecolor="white" ) axes[1 ,1 ].set_title("V14 distribution" ); axes[1 ,2 ].hist(df_out2['V3' ], bins=60 , linewidth=0.5 , edgecolor="white" ) axes[1 ,2 ].set_title("V3 distribution" ); axes[2 ,0 ].hist(df_out2['V7' ], bins=60 , linewidth=0.5 , edgecolor="white" ) axes[2 ,0 ].set_title("V7 distribution" ); axes[2 ,1 ].hist(df_out2['V11' ], bins=60 , linewidth=0.5 , edgecolor="white" ) axes[2 ,1 ].set_title("V11 distribution" ); axes[2 ,2 ].hist(df_out2['V4' ], bins=60 , linewidth=0.5 , edgecolor="white" ) axes[2 ,2 ].set_title("V4 distribution" ); plt.tight_layout() plt.show()
Z-score方法 Z-score方法是一种用于标准化数据的统计技术,主要用于识别异常值和比较不同数据集。Z-score表示一个数据点与总体均值之间的距离,以标准差 为单位。Z-score(标准分数)是一个数值,表示某个数据点与总体均值的偏离程度。计算公式为:Z-score方法的计算步骤为:1. 确定原始数据值原始数据值 、均值 和标准差 代入公式,计算出Z-score)。Z-score方法是一种有效且广泛应用的工具,用于分析和比较数据。它通过标准化数据,使得在不同条件下的数据分析变得更加直观和可行。
1 2 3 4 5 6 7 8 9 10 11 12 13 14 15 16 17 18 19 20 21 22 23 24 25 26 27 28 29 30 31 32 33 34 35 36 37 38 39 40 41 42 43 44 45 46 47 48 49 50 51 52 53 54 55 56 57 58 59 60 61 62 63 64 65 66 67 68 69 70 71 72 73 74 75 76 77 78 79 80 81 82 import numpy as npimport pandas as pdimport seaborn as snsfrom matplotlib import pyplot as pltfrom collections import Counterdf_raw = pd.read_csv('../input/fraud-detection/creditcard.csv' ) df=df_raw.drop(['Time' ], axis=1 ) feature_list = ['V1' , 'V2' , 'V3' , 'V4' , 'V5' , 'V6' , 'V7' , 'V8' , 'V9' , 'V10' , 'V11' ,'V12' , 'V13' , 'V14' , 'V15' , 'V16' , 'V17' , 'V18' , 'V19' , 'V20' , 'V21' ,'V22' , 'V23' , 'V24' , 'V25' , 'V26' , 'V27' , 'V28' , 'Amount' ] def z_score_method (df,n,features): """ Takes a dataframe df of features and returns an index list corresponding to the observations containing more than n outliers according to the z-score method. """ outlier_list = [] for column in features: data_mean = df[column].mean() data_std = df[column].std() threshold = 3 z_score = abs ( (df[column] - data_mean)/data_std ) outlier_list_column = df[z_score > threshold].index outlier_list.extend(outlier_list_column) outlier_list = Counter(outlier_list) multiple_outliers = list ( k for k, v in outlier_list.items() if v > n ) df1 = df[z_score > threshold] print ('Total number of outliers is:' , df1.shape[0 ]) return multiple_outliers Outliers_z_score = z_score_method(df,1 ,feature_list) df_out3 = df.drop(Outliers_z_score, axis = 0 ).reset_index(drop=True ) fig, axes = plt.subplots(nrows=3 , ncols=3 ,figsize=(13 ,8 )) fig.suptitle('Distributions of most important features after dropping outliers using z-score\n' , size = 18 ) axes[0 ,0 ].hist(df_out3['V17' ], bins=60 , linewidth=0.5 , edgecolor="white" ) axes[0 ,0 ].set_title("V17 distribution" ); axes[0 ,1 ].hist(df_out3['V10' ], bins=60 , linewidth=0.5 , edgecolor="white" ) axes[0 ,1 ].set_title("V10 distribution" ); axes[0 ,2 ].hist(df_out3['V12' ], bins=60 , linewidth=0.5 , edgecolor="white" ) axes[0 ,2 ].set_title("V12 distribution" ); axes[1 ,0 ].hist(df_out3['V16' ], bins=60 , linewidth=0.5 , edgecolor="white" ) axes[1 ,0 ].set_title("V16 distribution" ); axes[1 ,1 ].hist(df_out3['V14' ], bins=60 , linewidth=0.5 , edgecolor="white" ) axes[1 ,1 ].set_title("V14 distribution" ); axes[1 ,2 ].hist(df_out3['V3' ], bins=60 , linewidth=0.5 , edgecolor="white" ) axes[1 ,2 ].set_title("V3 distribution" ); axes[2 ,0 ].hist(df_out3['V7' ], bins=60 , linewidth=0.5 , edgecolor="white" ) axes[2 ,0 ].set_title("V7 distribution" ); axes[2 ,1 ].hist(df_out3['V11' ], bins=60 , linewidth=0.5 , edgecolor="white" ) axes[2 ,1 ].set_title("V11 distribution" ); axes[2 ,2 ].hist(df_out3['V4' ], bins=60 , linewidth=0.5 , edgecolor="white" ) axes[2 ,2 ].set_title("V4 distribution" ); plt.tight_layout() plt.show()
Modified Z-score方法 Modified Z-score方法是一种用于识别异常值的统计方法,旨在克服传统Z-score在处理小样本或受极端值影响时的局限性。Modified Z-score使用中位数 和绝对偏差 来计算,使其对异常值更具鲁棒性 。Modified Z-score的计算公式:Modified Z-score值,Median Absolute Deviation),计算公式为MAD,求出所有绝对偏差的中位数,得到MAD;计算修正Z-score,将每个数据点代入修正Z-score公式。通常情况下,如果Modified Z-score的绝对值大于3,则该数据点被认为是异常值。这一阈值可以根据具体情况进行调整。Modified Z-score是一种有效且鲁棒的方法,用于检测异常值。通过利用中位数和绝对偏差,这一方法能够提供更可靠的数据分析结果,尤其是在存在极端值或小样本时。
DBSCAN算法 DBSCAN是一种强大的基于密度的数据聚类算法。聚类是一种无监督学习技术,我们尝试根据特定特征对数据点进行分组。DBSCAN由Martin Ester等人于1996年提出。它基于这样的假设:聚类是空间中由低密度区域分隔的密集区域 。为了对数据点进行聚类 ,DBSCAN算法将数据的高密度区域 与低密度区域 分开。它使用距离和每个聚类的最小点数将点分类为异常值。此方法类似于K-means聚类。广泛应用于无监督机器学习 任务,尤其适用于数据具有任意形状或大小的情况。它通过识别高密度区域中的点来形成聚类,同时将低密度区域中的点视为噪声。DBSCAN算法不对数据的分布方式做出假设。DBSCAN算法的算法原理为将数据点分为三类:
核心点 :在指定半径内(minPoints个邻居的数据点;边界点 :距离某个核心点很近,但在其邻域内的邻居数量少于minPoints的数据点;噪声点 :既不是核心点也不是边界点的数据点。
DBSCAN算法步骤为:
选择一个未访问的点 :从数据集中随机选择一个未访问的点,并标记为已访问;查找邻域 :计算该点的扩展聚类 :对于每个邻域内的点,检查它们是否也是核心点。如果是,则继续查找其邻域并将这些点添加到聚类 中。处理边界和噪声 :如果选定的点是边界点,则将其添加到最近的核心点所在的聚类中。如果没有找到核心点,则将其标记为噪声。重复以上步骤:直到所有数据点都被访问过。
DBSCAN需要两个主要参数:epsilon),定义邻域的半径;minPoints,在核心点 。DBSCAN在多个领域中得到了广泛应用,包括客户细分、图像分割、异常检测、环境监测。DBSCAN是一种强大的聚类 算法,适用于多种实际应用场景。它通过基于密度 的方法有效地处理复杂形状的数据集,并能够识别出噪声,从而提高了数据分析的准确性和可靠性。
扩展单类支持向量机(OCSVM) 扩展单类支持向量机 (OCSVM)算法,以有效处理更大的数据集并提高其在实际应用中的性能。OCSVM主要用于异常检测,它学习单个类的特征并识别该偏差。通过采用增量学习、并行化、样本选择、降维和集成学习等技术,可以有效地扩展One-Class SVM算法,使其能够处理更大规模的数据集,同时保持高效的异常检测能力。这些改进使得OCSVM在实际应用中更具可行性和实用性。

![]()
![]()
