1
2
3
4
5
6
7
8
9
10
11
12
13
14
15
16
17
18
19
20
21
22
23
24
25
26
27
28
29
30
31
32
33
34
35
36
37
38
39
40
41
42
43
44
45
46
47
48
49
50
51
52
53
54
55
56
57
58
59
60
61
62
63
64
65
66
| from math import sin, cos
def euler_to_Rot(yaw, pitch, roll):
Y = np.array([[cos(yaw), 0, sin(yaw)],[0, 1, 0],[-sin(yaw), 0, cos(yaw)]])
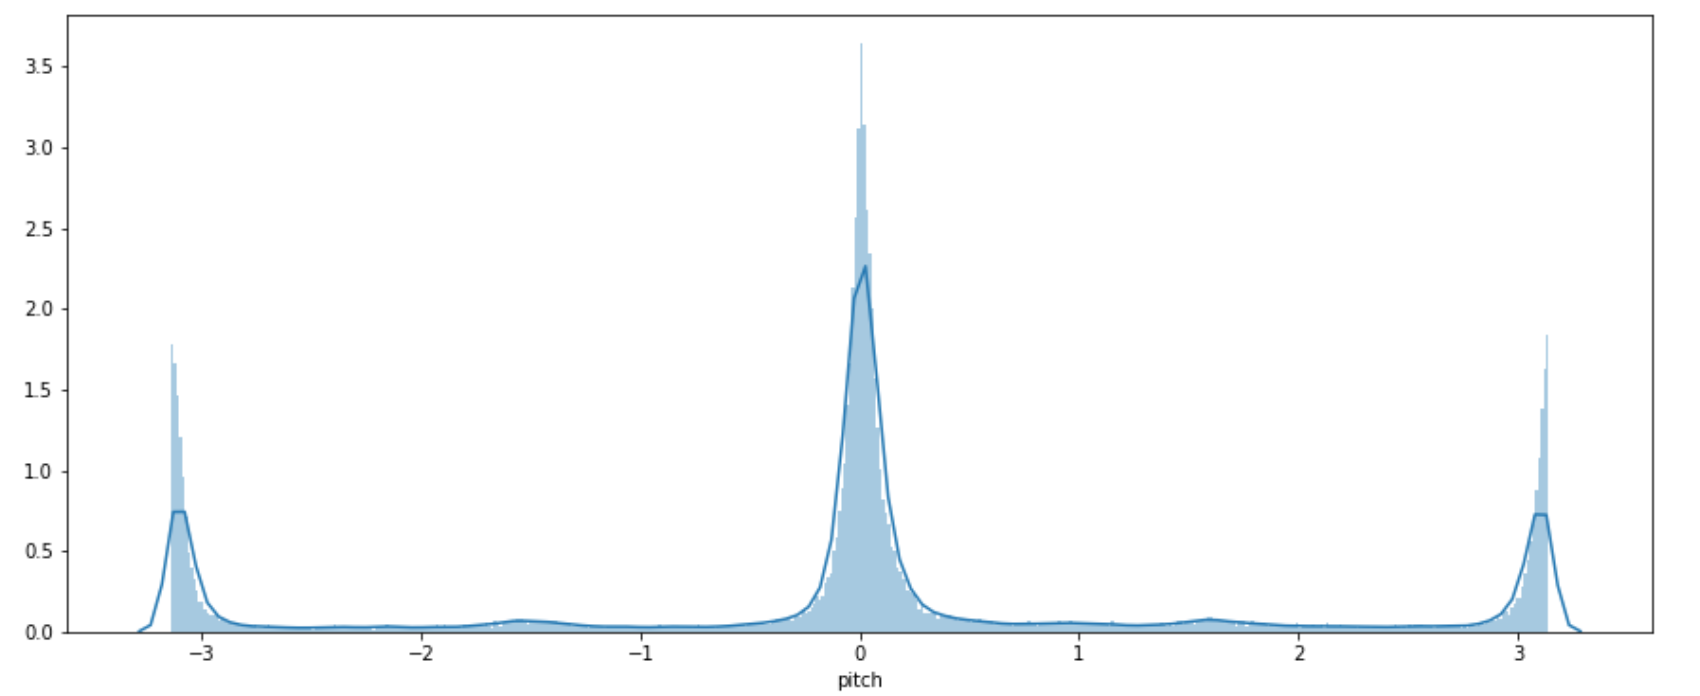
P = np.array([[1, 0, 0],[0, cos(pitch), -sin(pitch)],[0, sin(pitch), cos(pitch)]])
R = np.array([[cos(roll), -sin(roll), 0],[sin(roll), cos(roll), 0],[0, 0, 1]])
return np.dot(Y, np.dot(P, R))
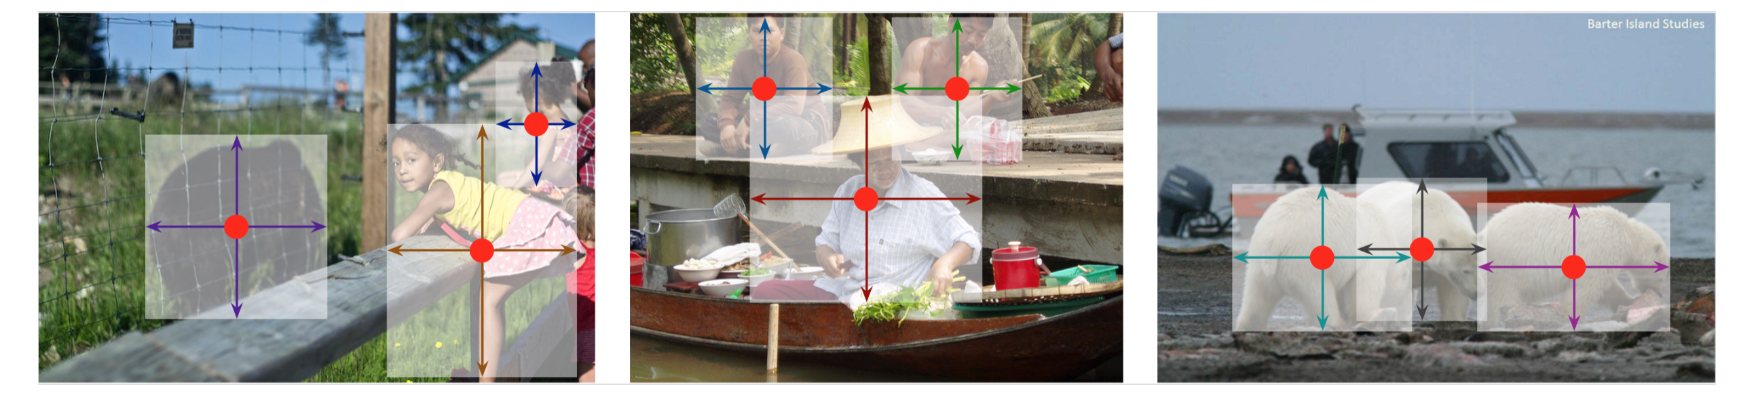
def visualize(img, coords):
x_l = 1.02
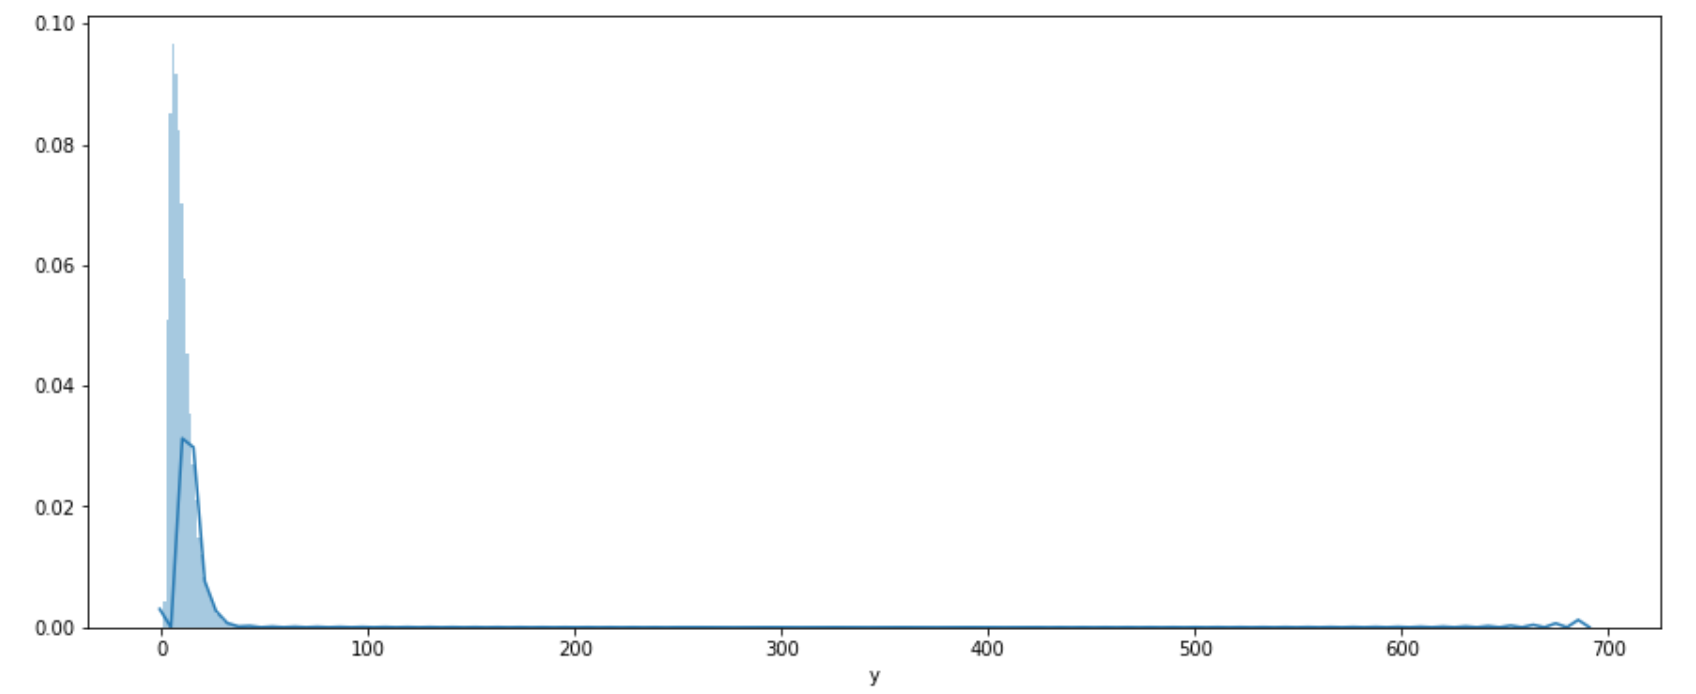
y_l = 0.80
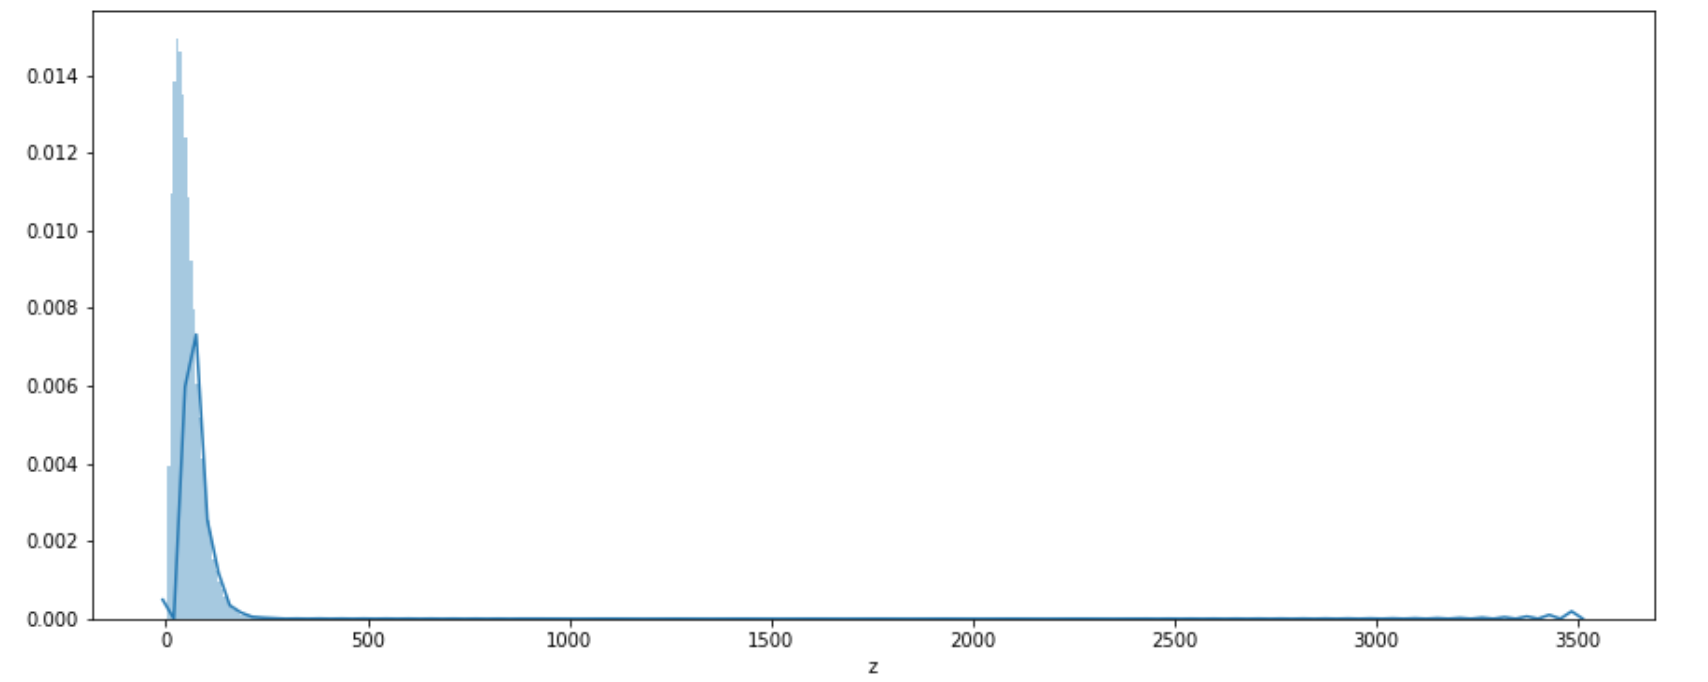
z_l = 2.31
img = img.copy()
for point in coords:
x, y, z = point['x'], point['y'], point['z']
yaw, pitch, roll = -point['pitch'], -point['yaw'], -point['roll']
Rt = np.eye(4)
t = np.array([x, y, z])
Rt[:3, 3] = t
Rt[:3, :3] = euler_to_Rot(yaw, pitch, roll).T
Rt = Rt[:3, :]
P = np.array([[x_l, -y_l, -z_l, 1],
[x_l, -y_l, z_l, 1],
[-x_l, -y_l, z_l, 1],
[-x_l, -y_l, -z_l, 1],
[0, 0, 0, 1]]).T
img_cor_points = np.dot(camera_matrix, np.dot(Rt, P))
img_cor_points = img_cor_points.T
img_cor_points[:, 0] /= img_cor_points[:, 2]
img_cor_points[:, 1] /= img_cor_points[:, 2]
img_cor_points = img_cor_points.astype(int)
img = draw_line(img, img_cor_points)
img = draw_points(img, img_cor_points[-1:])
return img
def draw_line(image, points):
color = (255, 0, 0)
cv2.line(image, tuple(points[0][:2]), tuple(points[3][:2]), color, 16)
cv2.line(image, tuple(points[0][:2]), tuple(points[1][:2]), color, 16)
cv2.line(image, tuple(points[1][:2]), tuple(points[2][:2]), color, 16)
cv2.line(image, tuple(points[2][:2]), tuple(points[3][:2]), color, 16)
return image
def draw_points(image, points):
for (p_x, p_y, p_z) in points:
cv2.circle(image, (p_x, p_y), int(1000 / p_z), (0, 255, 0), -1)
return image
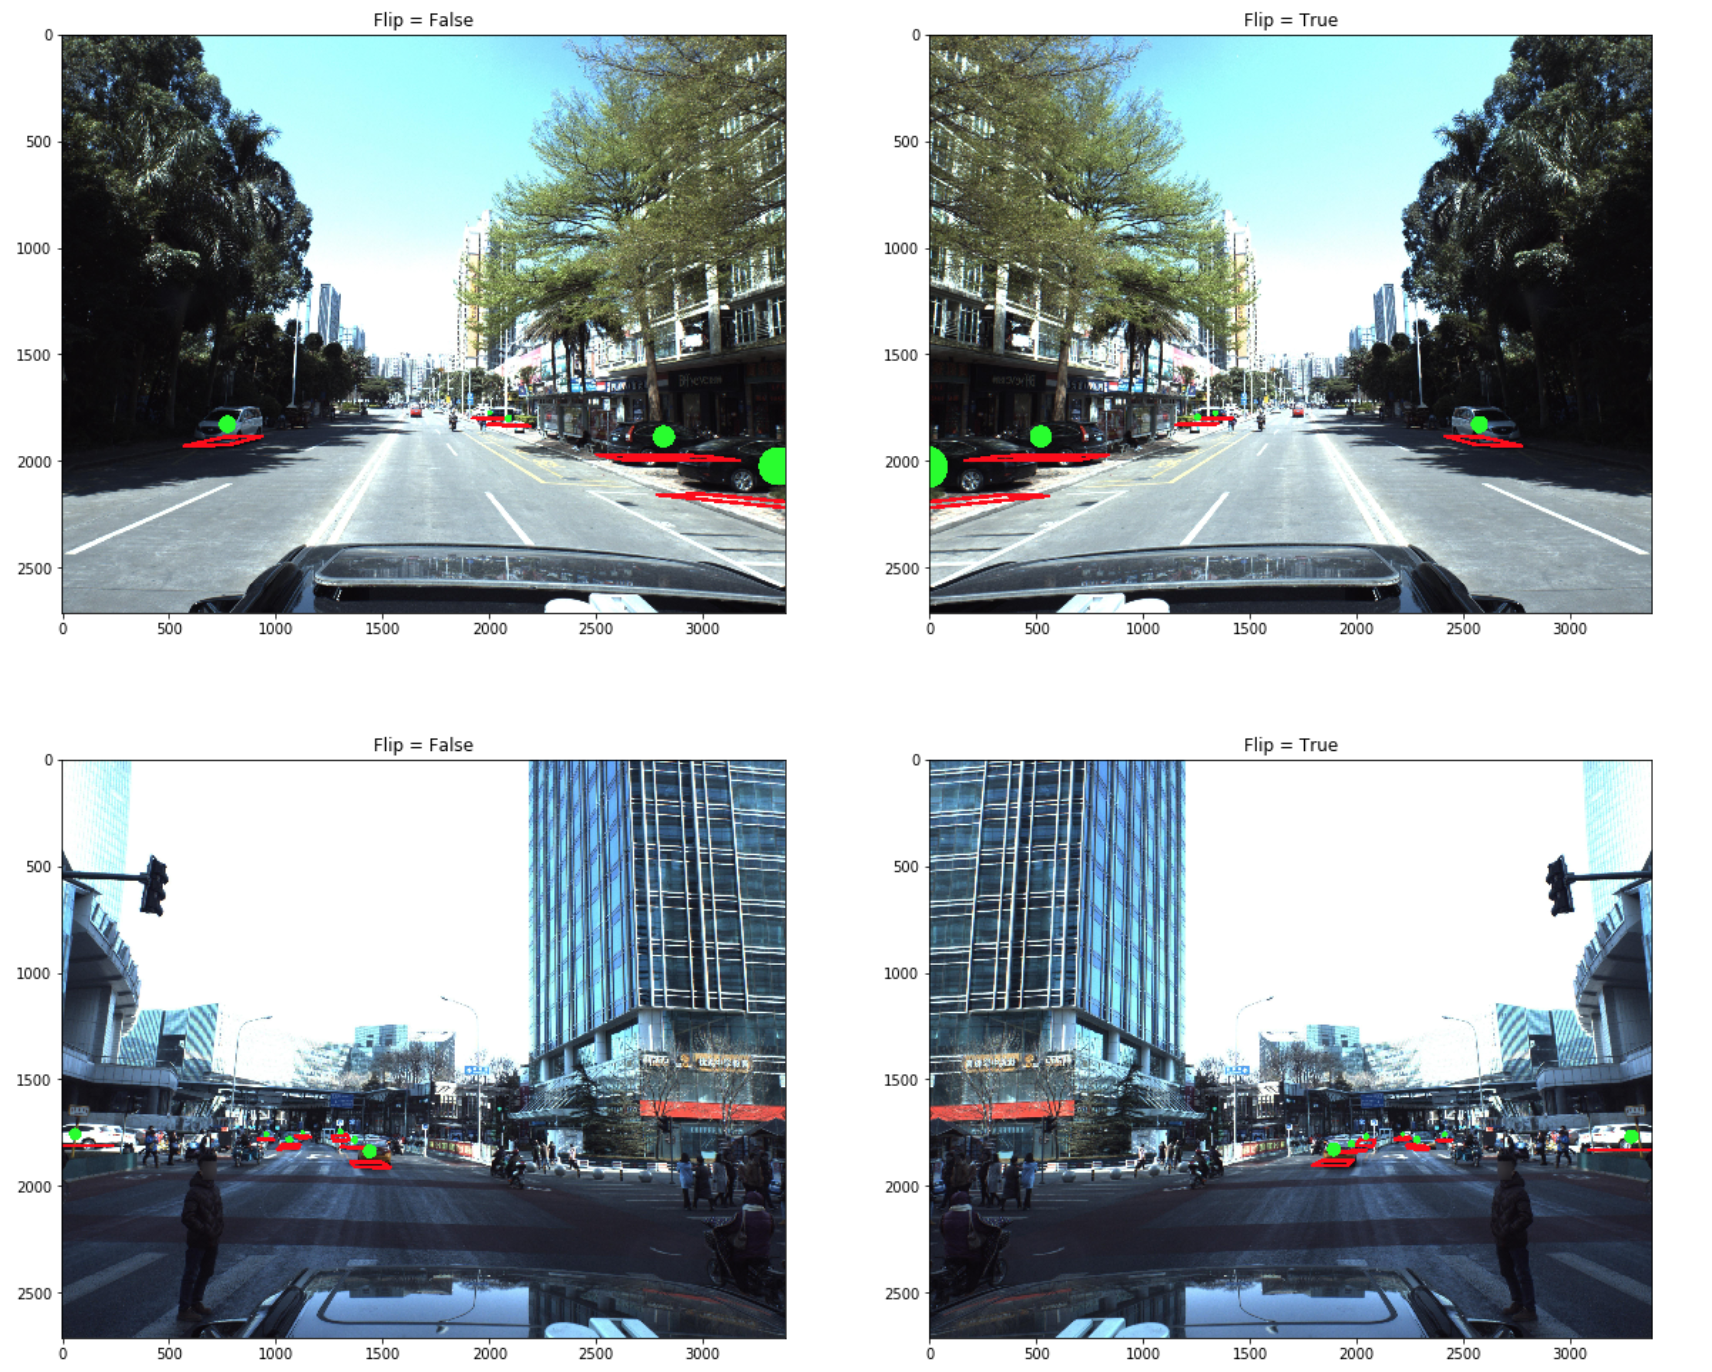
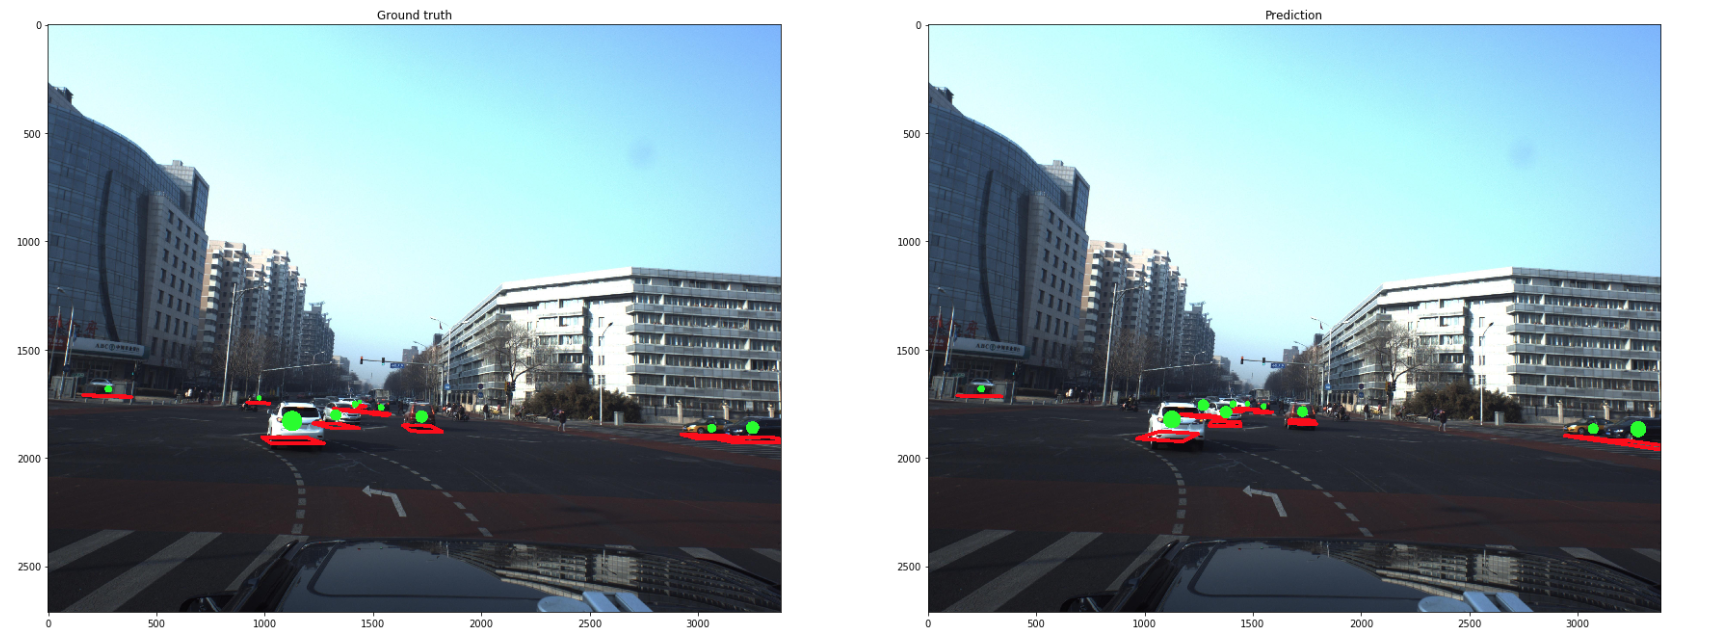
n_rows = 6
for idx in range(n_rows):
fig, axes = plt.subplots(1, 2, figsize=(20,20))
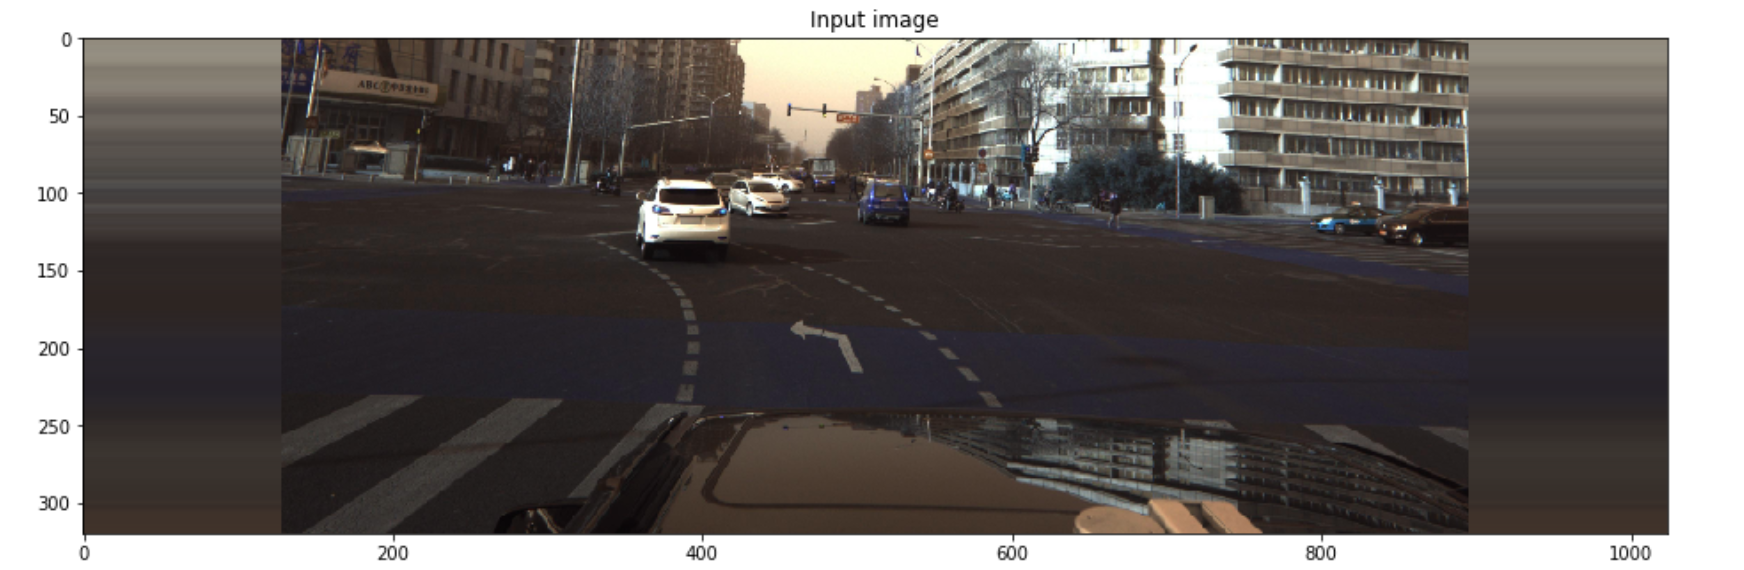
img = imread(PATH + 'train_images/' + train['ImageId'].iloc[idx] + '.jpg')
axes[0].imshow(img)
img_vis = visualize(img, str2coords(train['PredictionString'].iloc[idx]))
axes[1].imshow(img_vis)
plt.show()
|