数据清理(Pandas)
处理缺失值
数据清理是数据科学的关键部分,但它可能会令人深感沮丧。为什么有些文本字段出现乱码?对于那些缺失的值你应该做什么?为什么您的日期格式不正确?如何快速清理不一致的数据输入?您将学习如何解决一些最常见的数据清理问题,以便您可以更快地分析数据。 您将使用真实、混乱的数据完成五个实践练习,并解决一些最常见的数据清理问题。
先看一下数据
我们需要做的第一件事是加载我们将使用的库和数据集。为了进行演示,我们将使用美式橄榄球比赛中发生的事件的数据集。在以下练习中,您将把新技能应用于旧金山颁发的建筑许可证数据集。
1 | # modules we'll use |
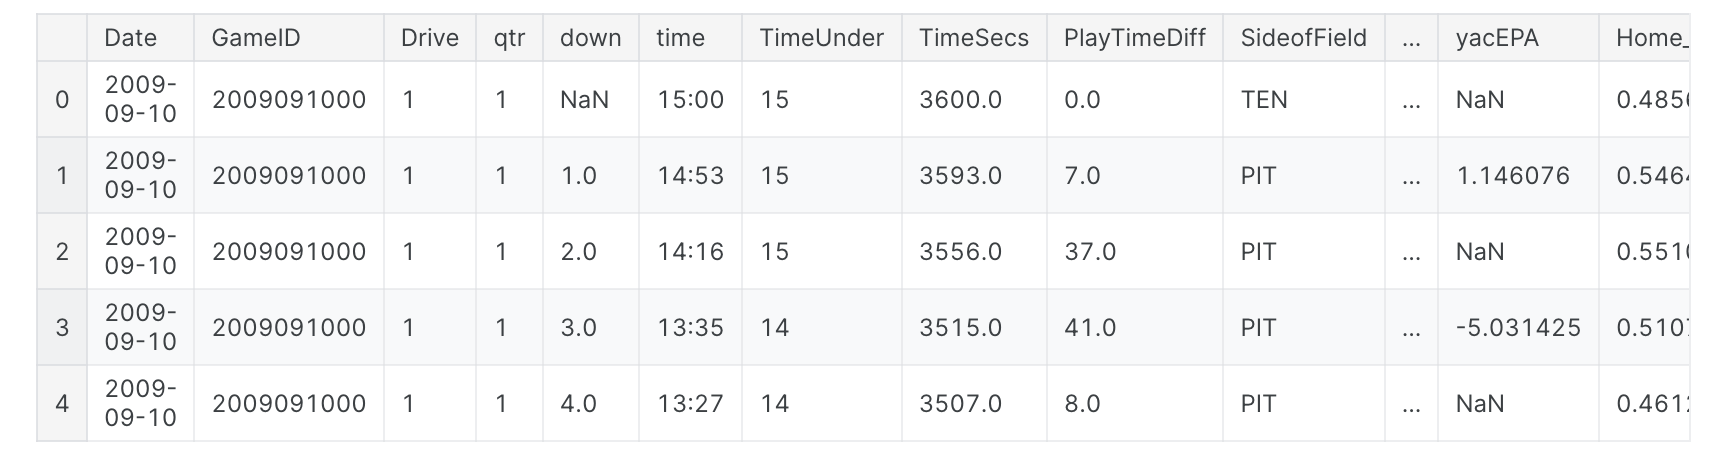
当您获得新数据集时要做的第一件事就是查看其中的内容。这可以让您正确读取所有内容,并了解数据的情况。在这种情况下,让我们看看是否有任何缺失值,这些值将用NaN或None表示。
1 | # look at the first five rows of the nfl_data file. |
我们有多少个缺失的数据?
现在我们知道我们确实有一些缺失值。让我们看看每列中有多少个。
1 | # get the number of missing data points per column |
结果输出为:
1 | Date 0 |
看起来好像很多啊!查看数据集中缺失的值的百分比可能会有所帮助,以便我们更好地了解此问题的规模:
1 | # how many total missing values do we have? |
结果输出为:
1 | 24.87214126835169 |
这个数据集中几乎四分之一的单元格是空的!在下一步中,我们将仔细查看一些缺少值的列,并尝试找出它们可能发生的情况。
找出数据丢失的原因
让我们来看一个例子。查看nfl_data数据框中缺失值的数量,我注意到“TimesSec”列中有很多缺失值:
1 | # look at the # of missing points in the first ten columns |
结果输出为:
1 | Date 0 |
通过查看文档,我可以看到该列包含有关游戏进行时剩余秒数的信息。这意味着这些值可能丢失,因为它们没有被记录,而不是因为它们不存在。因此,我们尝试猜测它们应该是什么而不是仅仅将它们保留为NA。另一方面,还有其他字段,例如“PenalizedTeam”,也有很多缺失字段。但在这种情况下,该字段缺失,因为如果没有处罚,那么说哪支球队受到处罚就没有意义。对于此列,将其留空或添加第三个值(例如“两者都不是”)并使用它来替换NA会更有意义。
提示:如果您还没有阅读数据集文档,这是一个阅读数据集文档的好地方! 如果您正在使用从其他人那里获得的数据集,您也可以尝试联系他们以获取更多信息。
如果您正在进行非常仔细的数据分析,此时您需要单独查看每一列,以找出填充这些缺失值的最佳策略。
删除缺失值
如果您很着急或没有找出值缺失的原因,您可以选择删除包含缺失值的任何行或列。如果您确定要删除缺少值的行,pandas确实有一个方便的函数dropna()来帮助您执行此操作。让我们在NFL数据集上尝试一下!
1 | # remove all the rows that contain a missing value |
1 | # remove all columns with at least one missing value |
我们一共丢失了多少数据:
1 | # just how much data did we lose? |
结果输出为:
1 | Columns in original dataset: 102 |
我们丢失了相当多的数据,但此时我们已经成功地从数据中删除了所有NaN。
自动填充缺失值
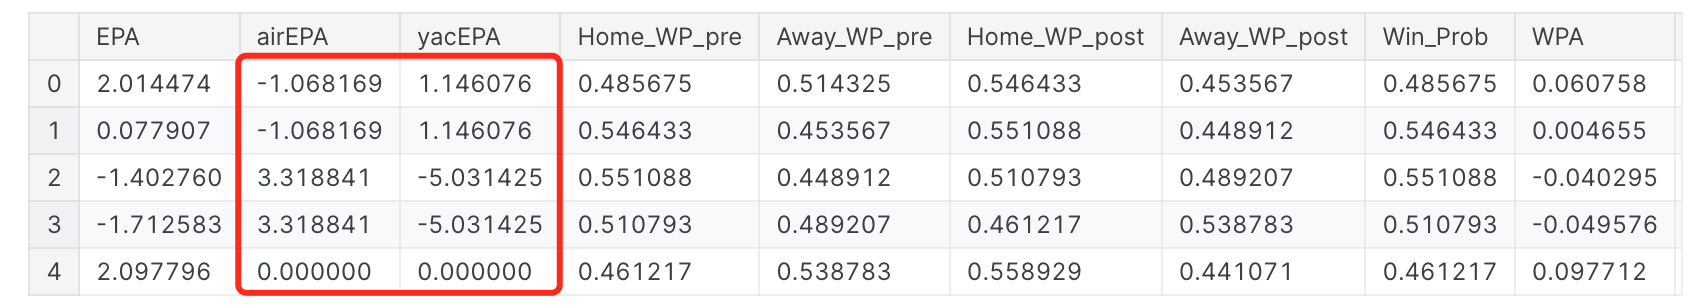
另一种选择是尝试填写缺失的值。对于接下来的部分,我将获取NFL数据的一小部分,以便它可以很好地打印。
1 | # get a small subset of the NFL dataset |
我们可以使用Panda的fillna()函数来填充数据框中的缺失值。我们的一种选择是指定我们想要用什么来替换NaN值。在这里,我想说的是我想用0替换所有NaN值。
1 | # replace all NA's with 0 |
我还可以更精明一点,用同一列中紧随其后的任何值替换缺失值。
1 | # replace all NA's the value that comes directly after it in the same column, |
结果输出为:
缩放和标准化
设置环境
1 | # modules we'll use |
缩放与标准化:有什么区别?
缩放和标准化之间很容易混淆的原因之一:是因为这些术语有时可以互换使用,而且更令人困惑的是,它们非常相似!在这两种情况下,您都会转换数值变量的值,以便转换后的数据点具有特定的有用属性。不同之处在于:
- 在缩放中,您正在更改数据的范围。
- 在标准化过程中,您正在改变数据分布的形状。
让我们更深入地讨论一下每个选项。
缩放(Scaling)
这意味着您正在转换数据,使其适合特定的范围,例如0-100或0-1。当您使用基于数据点距离度量的方法(例如支持向量机(SVM)或k最近邻(KNN))时,您需要缩放数据。使用这些算法,任何数字特征中“1”的变化都被赋予相同的重要性。例如,您可能会查看某些产品的日元和美元价格。1美元大约值100日元,但如果你不调整价格,SVM或KNN等方法会认为1日元的价格差异与1美元的差异一样重要!这显然不符合我们对世界的直觉。使用货币,您可以在货币之间进行转换。但是如果您要查看身高和体重之类的数据怎么办?目前尚不完全清楚多少磅应等于一英寸(或多少公斤应等于一米)。通过缩放变量,您可以帮助在平等的基础上比较不同的变量。为了帮助巩固缩放的外观,让我们看一个虚构的示例。
1 | # generate 1000 data points randomly drawn from an exponential distribution |
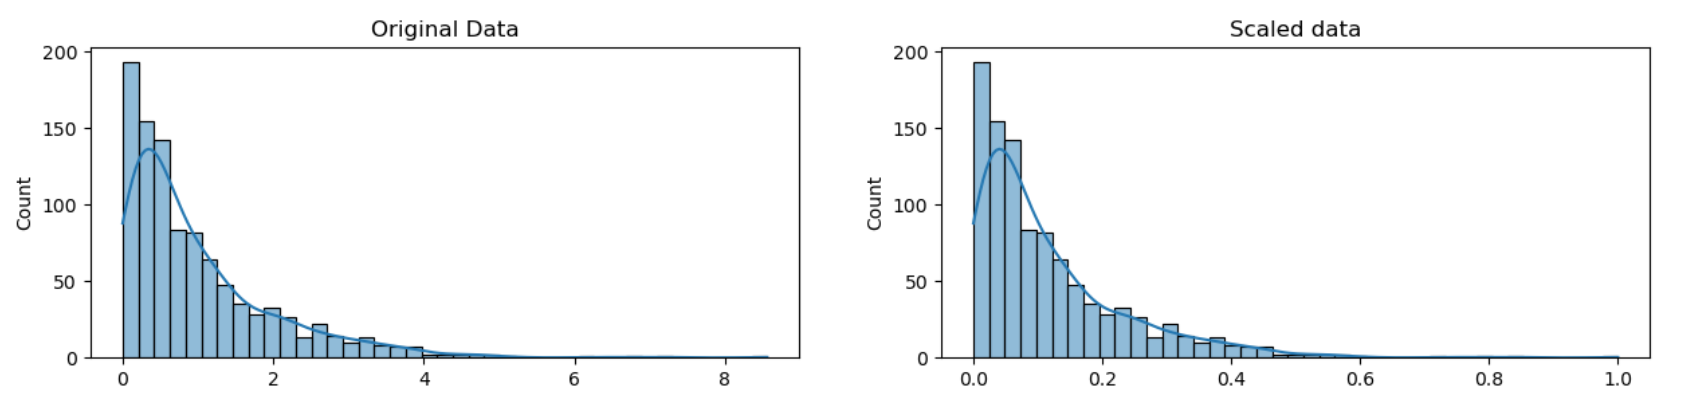
请注意,数据的形状没有改变,但范围不再是0到8,而是现在的范围是 0到1。
标准化(Normalization)
缩放只会改变数据的范围。标准化是一种更彻底的转变。标准化的目的是改变您的观察结果,以便将它们描述为正态分布。正态分布:也称为“钟形曲线”,这是一种特定的统计分布,其中大致相等的观测值落在平均值之上和之下,平均值和中位数相同,并且接近平均值的观测值较多。正态分布也称为高斯分布。一般来说,如果您要使用假设数据呈正态分布的机器学习或统计技术,则需要对数据进行标准化。其中的一些示例包括线性判别分析(LDA)和高斯朴素贝叶斯。(专业提示:名称中带有“高斯”的任何方法都可能假设正态分布。)我们在这里用来标准化的方法称为Box-Cox变换。让我们快速浏览一下一些数据的标准化是什么样子的:
1 | # normalize the exponential data with boxcox |
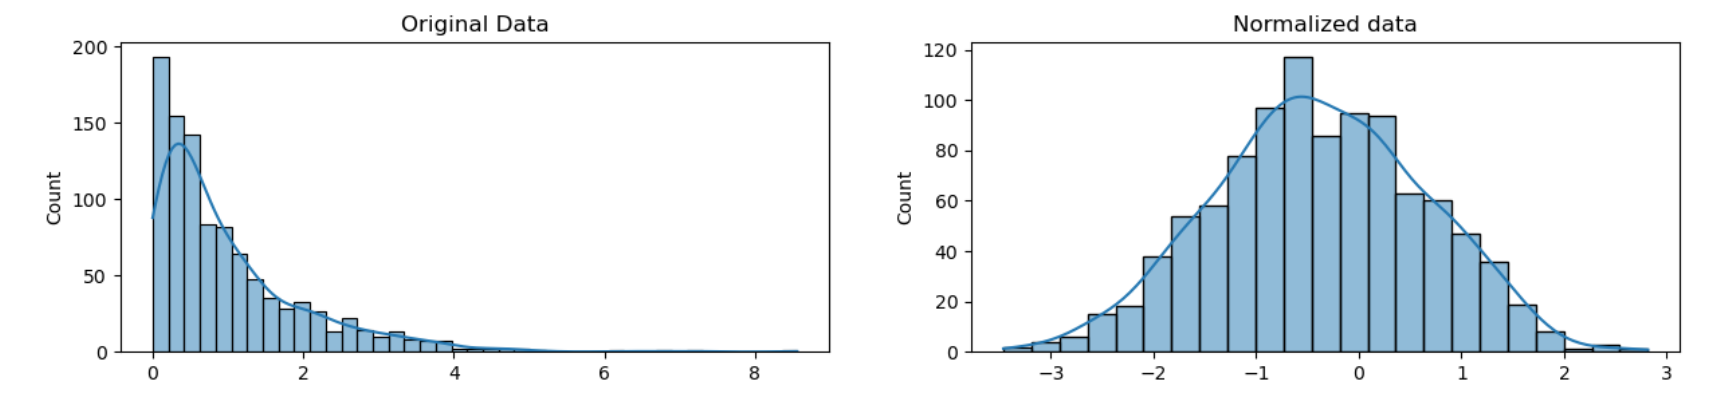
请注意,我们的数据形状已经改变。在标准化之前它几乎是L形的。但标准化后,它看起来更像钟形的轮廓(因此称为“钟形曲线”)。
解析日期(Parsing Dates)
设置环境
我们需要做的第一件事是加载我们将使用的库和数据集。我们将使用包含2007年至2016年期间发生的山体滑坡信息的数据集。在下面的练习中,您将把新技能应用于全球地震数据集。
1 | # modules we'll use |
检查日期列的数据类型
我们首先查看数据的前五行。
1 | landslides.head() |
我们将使用landslides数据框中的“日期”列。让我们确保它实际上看起来包含日期。
1 | # print the first few rows of the date column |
结果输出为:
1 | 0 3/2/07 |
请注意,在head()输出的底部,您可以看到该列的数据类型是“object”。Pandas使用“object”数据类型来存储各种类型的数据类型,但大多数情况下,当您看到数据类型为“object”的列时,它会包含字符串。如果您在此处查看pandas dtype文档,您会注意到还有一个特定的datetime64 dtypes。因为我们列的数据类型是object而不是datetime64,所以我们可以看出Python不知道该列包含日期。我们还可以只查看列的dtype,而不打印前几行:
1 | # check the data type of our date column |
结果输出为:
1 | dtype('O') |
您可能需要检查numpy文档以将字母代码与对象的数据类型相匹配。“O”是“object”的代码,所以我们可以看到这两个方法给了我们相同的信息。
将日期列转换为日期时间
现在,我们知道我们的日期列并未被视为日期,现在将其转换为日期了,以便将其视为日期。这称为“解析日期”,因为我们正在使用一个字符串并识别其组件部分。我们可以通过称为“Strftime指令”的指南来确定日期的格式,您可以在此链接中找到更多信息。基本思想是,您需要指出日期的哪些部分在哪里以及它们之间的标点符号是什么。日期有很多可能的部分,但最常见的是一天%d,一个月的%m,两位数的%y和四位数的%y。
1/17/07的格式为“%m/%d/%y”。17-1-2007的格式为“%d-%m-%Y”。
回顾一下山体滑坡数据集中“日期”列的头部,我们可以看到它的格式是“月/日/两位数年份”,因此我们可以使用与第一个示例相同的语法来解析我们的日期。
1 | # create a new column, date_parsed, with the parsed dates |
现在,当我检查新列的前几行时,我可以看到dtype是datetime64。我还可以看到我的日期已稍微重新排列,以便它们符合默认顺序日期时间对象(year-month-day)。
1 | # print the first few rows |
结果输出为:
1 | 0 2007-03-02 |
现在我们的日期已正确解析,我们可以以有用的方式与它们交互。
- 如果我遇到多种日期格式错误怎么办?虽然我们在此处指定日期格式,但有时当单列中有多种日期格式时,您会遇到错误。如果发生这种情况,您可以让
pandas尝试推断正确的日期格式应该是什么。你可以这样做:landslides['date_parsed'] = pd.to_datetime(landslides['Date'], infer_datetime_format=True)。 - 为什么不总是使用
infer_datetime_format = True?不总是让pandas猜测时间格式有两个重要原因。首先,pandas并不总是能够找出正确的日期格式,特别是如果有人在数据输入方面发挥了创意。第二个是它比指定日期的确切格式慢得多。
选择该月的某一天
现在我们有一列已解析的日期,我们可以提取信息,例如山体滑坡发生的月份中的哪一天。
1 | # get the day of the month from the date_parsed column |
结果输出为:
1 | 0 2.0 |
如果我们尝试从原始“日期”列中获取相同的信息,我们会收到错误:AttributeError:只能将.dt访问器与类似日期时间的值一起使用。这是因为dt.day不知道如何处理数据类型为“object”的列。尽管我们的数据帧中有日期,但我们必须先解析它们,然后才能以有用的方式与它们交互。
绘制该月的日期来检查日期解析
解析日期的最大危险之一是混淆月份和日期。to_datetime()函数确实有非常有用的错误消息,但仔细检查我们提取的月份中的日期是否有意义也没有什么坏处。为此,我们绘制该月各天的直方图。我们预计它的值在1到31之间,并且由于没有理由认为山体滑坡在每月的某些日子比其他日子更常见,因此分布相对均匀。(31日有所下降,因为并非所有月份都有31天。)让我们看看情况是否如此:
1 | # remove na's |
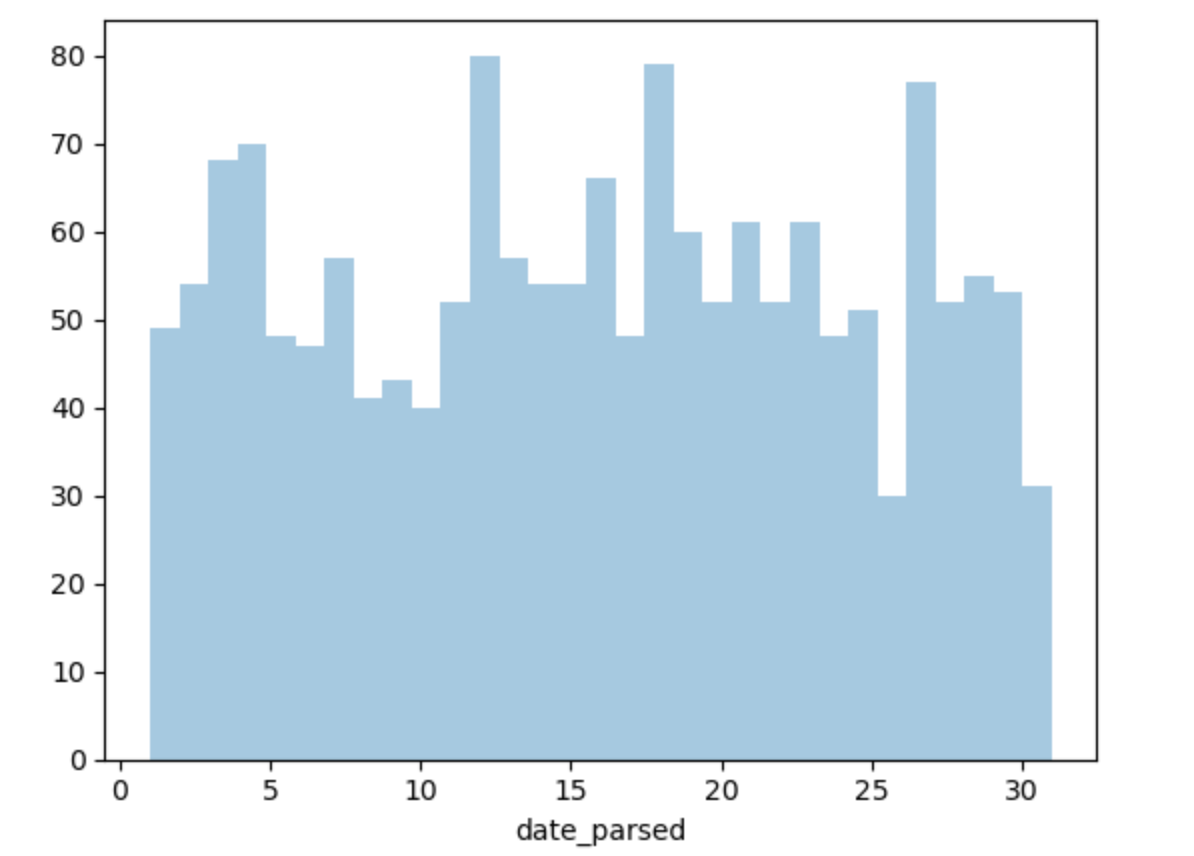
看起来我们确实正确解析了日期,并且这张图对我来说很有意义。
字符编码(Character Encodings)
设置环境
我们需要做的第一件事是加载我们将使用的库。
1 | # modules we'll use |
什么是编码?
字符编码是从原始二进制字节字符串(如下所示:0110100001101001)映射到构成人类可读文本的字符(如“hi”)的特定规则集。有许多不同的编码,如果您尝试使用与最初编写的编码不同的编码来读取文本,您最终会得到称为“mojibake”的乱序文本(如mo-gee-bah-kay)。这是mojibake的示例:æ–‡å—化ã??您也可能会遇到“未知”字符。当您用来读取字节字符串的编码中的特定字节和字符之间没有映射时,会打印一些内容,它们看起来像这样:����������如今,字符编码不匹配的情况比以前少见了,但这仍然是一个问题。有许多不同的字符编码,但您需要了解的主要一种是UTF-8。UTF-8是标准文本编码。所有Python代码均采用UTF-8格式,理想情况下,所有数据也应采用UTF-8格式。当内容不是UTF-8时,您就会遇到麻烦。
1 | # start with a string |
另一种数据是字节数据类型,它是整数序列。您可以通过指定字符串的编码将字符串转换为字节:
1 | # encode it to a different encoding, replacing characters that raise errors |
如果您查看bytes对象,您会发现它前面有一个b,后面可能还有一些文本。这是因为字节被打印出来,就好像它们是用ASCII编码的字符一样。(ASCII是一种较旧的字符编码,实际上不适用于编写英语以外的任何语言。)在这里您可以看到我们的欧元符号已被一些打印时看起来像“\xe2\x82\xac”的mojibake所取代 就像它是一个ASCII字符串一样。
1 | after |
当我们将字节转换回具有正确编码的字符串时,我们可以看到我们的文本都正确:
1 | # convert it back to utf-8 |
但是,当我们尝试使用不同的编码将字节映射到字符串时,我们会收到错误。这是因为我们尝试使用的编码不知道如何处理我们尝试传递的字节。您需要告诉Python字节字符串实际应该采用的编码。您可以将不同的编码视为录制音乐的不同方式。您可以将相同的音乐录制在CD、盒式磁带或8轨上。虽然音乐听起来或多或少相同,但您需要使用正确的设备来播放每种录音格式的音乐。正确的解码器就像磁带播放器或CD播放器。如果您尝试在CD播放器中播放盒式磁带,它就无法工作。
1 | # try to decode our bytes with the ascii encoding |
错误输出:
1 | --------------------------------------------------------------------------- |
如果我们尝试使用错误的编码从字符串映射到字节,我们也会遇到麻烦。正如我之前所说,Python 3中的字符串默认为UTF-8,因此如果我们尝试像使用其他编码一样对待它们,就会产生问题。例如,如果我们尝试使用encode()将字符串转换为ASCII字节,我们可以要求字节为ASCII时的字节。不过,由于我们的文本不是ASCII格式的,因此会有一些它无法处理的字符。我们可以自动替换ASCII无法处理的字符。但是,如果我们这样做,任何非ASCII字符都将被替换为未知字符。然后,当我们将字节转换回字符串时,该字符将被替换为未知字符。这样做的危险之处在于,无法判断它应该是哪个。这意味着我们可能使我们的数据无法使用!
1 | # start with a string |
这很糟糕,我们想避免这样做!最好尽快将所有文本转换为UTF-8并保留该编码。
读取有编码问题的文件
您遇到的大多数文件可能都是用UTF-8编码的。这是Python默认所期望的,所以大多数时候你不会遇到问题。但是,有时您会收到如下错误:
请注意,当我们尝试将UTF-8字节解码为ASCII时,我们得到了相同的UnicodeDecodeError!,这告诉我们这个文件实际上不是UTF-8。但我们不知道它实际上是什么编码。解决这个问题的一种方法是尝试测试一堆不同的字符编码,看看它们是否有效。不过,更好的方法是使用charset_normalizer模块来尝试自动猜测正确的编码是什么。它不能100%保证正确,但通常比仅仅尝试猜测要快。
我将只查看该文件的前一万个字节。这通常足以很好地猜测编码是什么,并且比尝试查看整个文件要快得多。(特别是对于大文件,这可能会非常慢。)仅查看文件第一部分的另一个原因是,通过查看错误消息,我们可以看到第一个问题是第11个字符。所以我们可能只需要查看文件的靠前一点的数据,就可以弄清楚发生了什么。
1 | # look at the first ten thousand bytes to guess the character encoding |
结果输出为:
1 | {'encoding': 'utf-8', 'language': 'English', 'confidence': 1.0} |
因此charset_normalizer分析后的正确编码为“Windows-1252”的置信度为73%。让我们看看这是否正确:
1 | # read in the file with the encoding detected by charset_normalizer |
看起来charset_normalizer分析是对的!该文件读入没有问题(尽管我们确实收到了有关数据类型的警告),并且当我们查看前几行时,它似乎没问题。如果charset_normalizer猜测的编码不正确怎么办?由于charset_normalizer基本上只是一个花哨的猜测器,有时它会猜测错误。您可以尝试的一件事是查看或多或少的文件,看看是否得到不同的结果,然后尝试。
使用UTF-8编码保存文件
最后,一旦您经历了将文件转换为UTF-8的所有麻烦,您可能会希望保持这种状态。最简单的方法是使用UTF-8编码保存文件。好消息是,由于UTF-8是Python的标准编码,因此当您保存文件时,它会默认保存为UTF-8:
1 | # save our file (will be saved as UTF-8 by default!) |
数据不一致(Inconsistent Data Entry)
设置环境
我们需要做的第一件事是加载我们将使用的库和数据集。
1 | # modules we'll use |
进行一些初步的文本预处理
我们首先快速浏览一下数据的前几行。
1 | professors.head() |
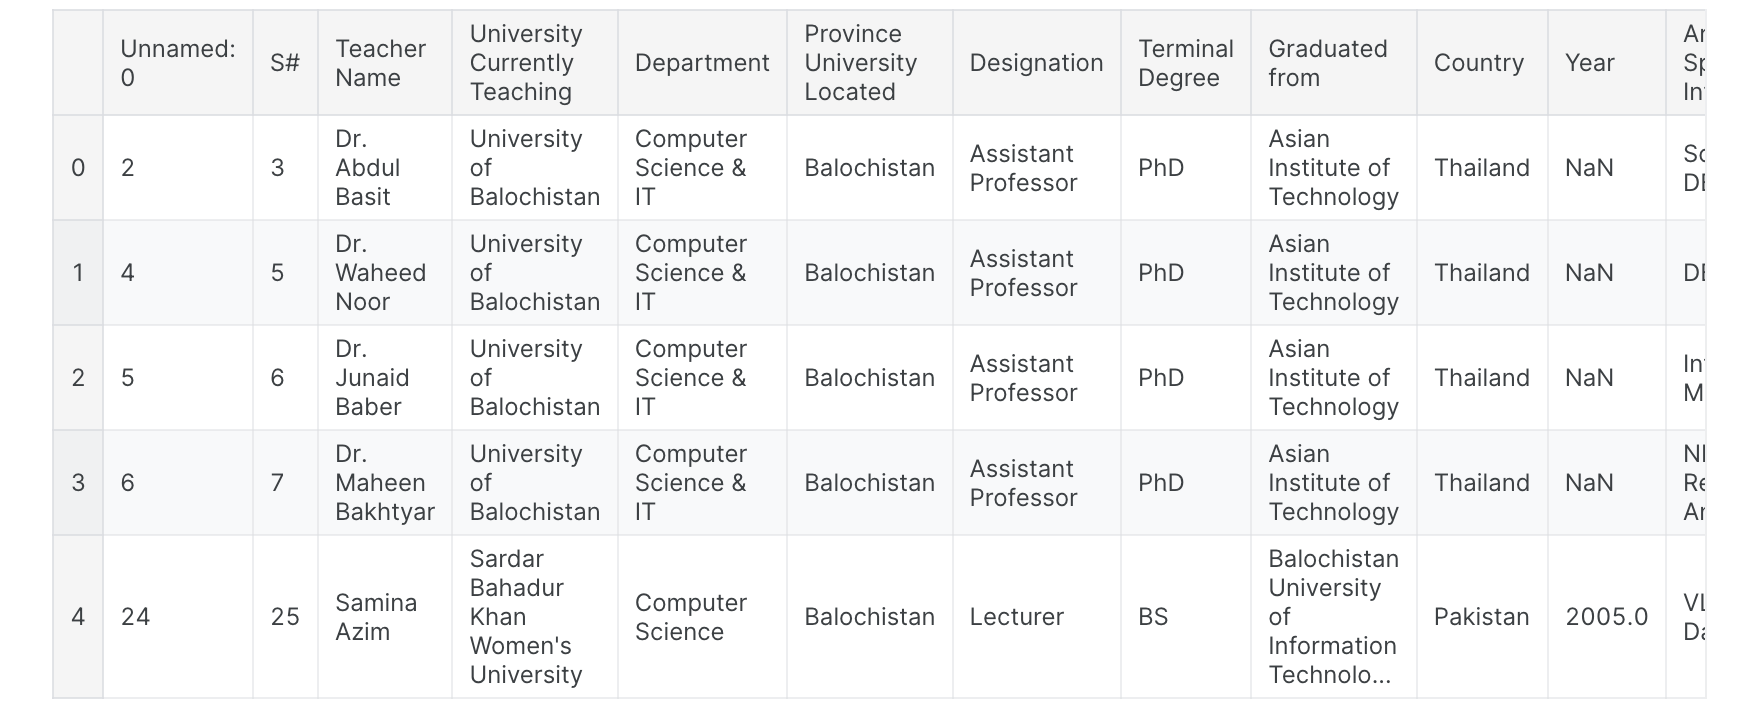
假设我们有兴趣清理“国家/地区”列,以确保其中不存在数据输入不一致的情况。当然,我们可以手动检查每一行,并在发现不一致时手动更正它们。不过,有一种更有效的方法可以做到这一点!
1 | # get all the unique values in the 'Country' column |
结果输出为:
1 | array([' Germany', ' New Zealand', ' Sweden', ' USA', 'Australia', |
只要看一下这个,我就可以看到由于数据输入不一致而导致的一些问题:例如“Germany”和“germany”,或者“New Zealand”和“New Zealand”。我要做的第一件事是将所有内容都变成小写(如果我愿意,我可以在末尾将其更改回来)并删除单元格开头和结尾处的所有空格。大写和尾随空格的不一致在文本数据中非常常见,通过执行此操作,您可以修复80%的文本数据输入不一致问题。
1 | # convert to lower case |
接下来我们将解决更困难的不一致问题。
使用模糊匹配来纠正不一致的数据输入
让我们再看一下“国家/地区”列,看看是否还需要进行更多的数据清理。
1 | # get all the unique values in the 'Country' column |
看起来确实存在另一个不一致之处:“southkorea”和“south korea”应该是相同的。我们将使用fuzzywuzzy包来帮助识别哪些字符串彼此最接近。这个数据集足够小,我们可能可以手动纠正错误,但这种方法不能很好地扩展。模糊匹配:自动查找与目标字符串非常相似的文本字符串的过程。一般来说,如果将一个字符串转换为另一个字符串,则需要更改的字符越少,则认为一个字符串与另一个字符串“越接近”。因此,“apple”和“snapple”彼此相距两个变化(添加“s”和“n”),而“in”和“on”则相距一个变化(将“i”替换为“o”)。您并不总是能够100%依赖模糊匹配,但它通常最终会至少为您节省一点时间。Fuzzywuzzy返回给定两个字符串的比率。该比率越接近100,两个字符串之间的编辑距离越小。在这里,我们将从距离“韩国”最近的城市列表中获取十个字符串。
1 | # get the top 10 closest matches to "south korea" |
结果输出为:
1 | [('south korea', 100), |
我们可以看到城市中有两个项目与“south korea”非常接近:“south korea”和“southkorea”。 让我们将“Country”列中比率> 47的所有行替换为“south korea”。为此,我将编写一个函数。(如果您认为可能需要多次执行特定任务,那么编写一个可以重用的通用函数是一个好主意。这可以使您不必过于频繁地复制和粘贴代码,从而节省时间并可以帮助您 防止错误。)
1 | # function to replace rows in the provided column of the provided dataframe |
现在我们有了一个函数,我们可以对其进行测试!
1 | # use the function we just wrote to replace close matches to "south korea" with "south korea" |
现在,让我们再次检查“国家/地区”列中的唯一值,并确保我们已正确处理了“韩国”。
1 | # get all the unique values in the 'Country' column |
结果输出为:
1 | array(['australia', 'austria', 'canada', 'china', 'finland', 'france', |
现在我们的数据框中只有“韩国”,我们不需要手动更改任何内容。